
Page 40 - Hydrography
P. 40
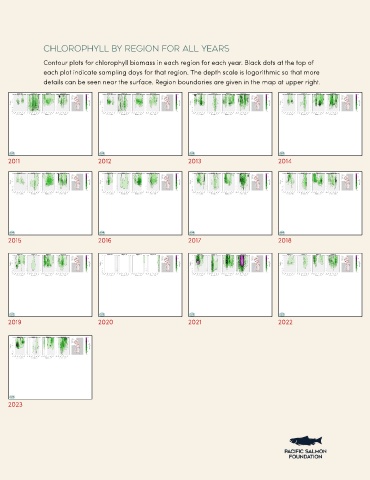
Chlorophyll by Region for All Years

               Contour plots for chlorophyll biomass in each region for each year. Black dots at the top of
               each plot indicate sampling days for that region. The depth scale is logarithmic so that more
               details can be seen near the surface. Region boundaries are given in the map at upper right.


    2011                         2012                          2013                          2014


    2015                         2016                          2017                          2018


    2019                         2020                          2021                          2022


    2023