
Page 12 - nutrients
P. 12
Time Series
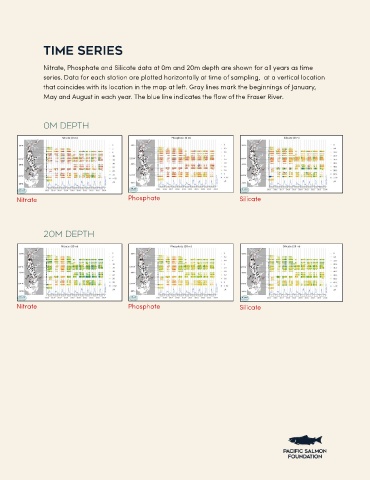
Nitrate, Phosphate and Silicate data at 0m and 20m depth are shown for all years as time
series. Data for each station are plotted horizontally at time of sampling, at a vertical location
that coincides with its location in the map at left. Gray lines mark the beginnings of January,
May and August in each year. The blue line indicates the flow of the Fraser River.
0m Depth
Nitrate Phosphate Silicate
20m Depth
Nitrate Phosphate Silicate