
Page 5 - nutrients
P. 5
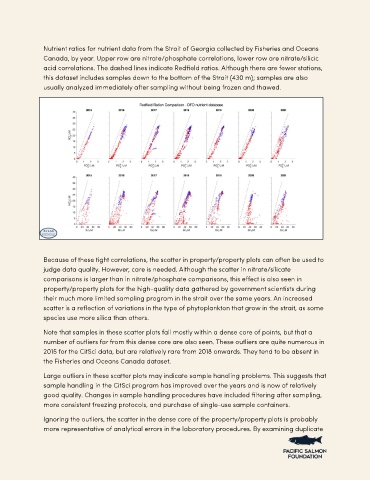
Nutrient ratios for nutrient data from the Strait of Georgia collected by Fisheries and Oceans
               Canada, by year. Upper row are nitrate/phosphate correlations, lower row are nitrate/silicic
               acid correlations. The dashed lines indicate Redfield ratios. Although there are fewer stations,
               this dataset includes samples down to the bottom of the Strait (430 m); samples are also
               usually analyzed immediately after sampling without being frozen and thawed.


               Because of these tight correlations, the scatter in property/property plots can often be used to
               judge data quality. However, care is needed. Although the scatter in nitrate/silicate
               comparisons is larger than in nitrate/phosphate comparisons, this effect is also seen in
               property/property plots for the high-quality data gathered by government scientists during
               their much more limited sampling program in the strait over the same years. An increased
               scatter is a reflection of variations in the type of phytoplankton that grow in the strait, as some
               species use more silica than others.

               Note that samples in these scatter plots fall mostly within a dense core of points, but that a
               number of outliers far from this dense core are also seen. These outliers are quite numerous in
               2015 for the CitSci data, but are relatively rare from 2018 onwards. They tend to be absent in
               the Fisheries and Oceans Canada dataset.

               Large outliers in these scatter plots may indicate sample handling problems. This suggests that
               sample handling in the CitSci program has improved over the years and is now of relatively
               good quality. Changes in sample handling procedures have included filtering after sampling,
               more consistent freezing protocols, and purchase of single-use sample containers.

               Ignoring the outliers, the scatter in the dense core of the property/property plots is probably
               more representative of analytical errors in the laboratory procedures. By examining duplicate