
Page 3 - HomeReadMe
P. 3
Key Figures
PSF CSOP station locations, as well as other sources of
oceanographic data for the Strait of Georgia. Track
plans for each patrol are shown in red. All stations along
the track have hydrographic profiles using a
conductivity-temperature-depth (CTD) probe, "Full"
stations also include water sampling for nutrients, and
"busy" stations also include both nutrients, chlorophyll,
and phytoplankton sampling.
Oceanographic stations in the Strait of
Georgia from the CSOP and other
programs
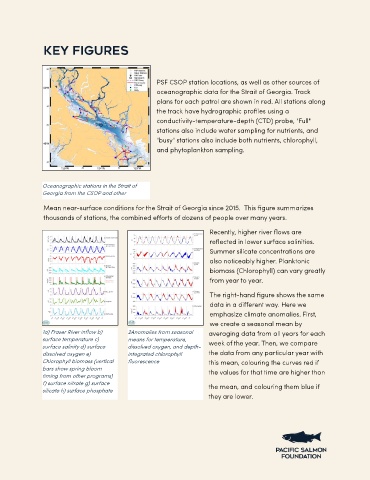
Mean near-surface conditions for the Strait of Georgia since 2015. This figure summarizes
thousands of stations, the combined efforts of dozens of people over many years.
Recently, higher river flows are
reflected in lower surface salinities.
Summer silicate concentrations are
also noticeably higher. Planktonic
biomass (Chlorophyll) can vary greatly
from year to year.
The right-hand figure shows the same
data in a different way. Here we
emphasize climate anomalies. First,
we create a seasonal mean by
1a) Fraser River inflow b) 2Anomalies from seasonal averaging data from all years for each
surface temperature c) means for temperature, week of the year. Then, we compare
surface salinity d) surface dissolved oxygen, and depth-
dissolved oxygen e) integrated chlorophyll the data from any particular year with
Chlorophyll biomass (vertical fluorescence this mean, colouring the curves red if
bars show spring bloom
the values for that time are higher than
timing from other programs)
f) surface nitrate g) surface the mean, and colouring them blue if
silicate h) surface phosphate
they are lower.