
Page 4 - HomeReadMe
P. 4
Instead of a line plot that shows condition at particular
depths, here we try to show mean conditions at all
depths for the Strait of Georgia by contouring the data
over 2D axes of depth (vertical) and time (horizontal).
In order the emphasize conditions near the surface,
the vertical scale is exaggerated near the surface and
compressed at depth.
White lines in upper (temperature) subplot indicate
temperatures of 17ºC, above which salmonids show
stress, and in the third row O2 concentrations of 187
μM (or 6ppm), below which salmonids also show a) Temperature in upper 150m of the Strait. b)
Salinity. c) Dissolved Oxygen. d) Chlorophyll (note
stress. Even though the Strait can be up to 400m deep, logarithmic depth scale)
salmonids are squeezed into a narrow depth range of
only about 15m in late summer! The lowest row shows
Chlorophyll concentrations, which are a measure of
the amount of phytoplankton - the base of food webs
that fish rely on (and are part of).
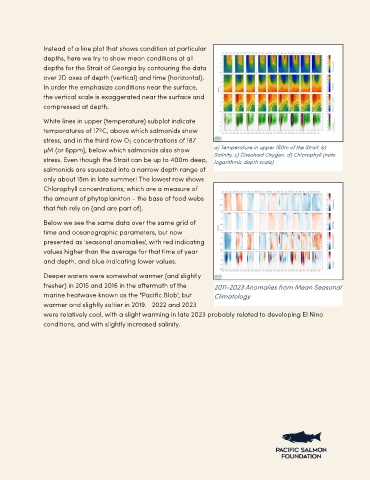
Below we see the same data over the same grid of
time and oceanographic parameters, but now
presented as 'seasonal anomalies', with red indicating
values higher than the average for that time of year
and depth, and blue indicating lower values.
Deeper waters were somewhat warmer (and slightly
fresher) in 2015 and 2016 in the aftermath of the 2011-2023 Anomalies from Mean Seasonal
marine heatwave known as the "Pacific Blob", but Climatology
warmer and slightly saltier in 2019. 2022 and 2023
were relatively cool, with a slight warming in late 2023 probably related to developing El Nino
conditions, and with slightly increased salinity.