
Page 13 - Hydrography
P. 13
Time-depth plots of mean and
regional variation (by year)
Mean Strait of Georgia Conditions for all years
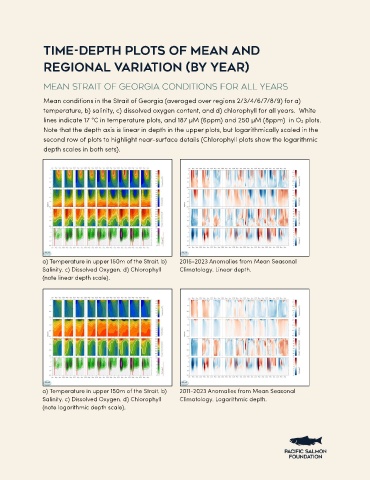
Mean conditions in the Strait of Georgia (averaged over regions 2/3/4/6/7/8/9) for a)
temperature, b) salinity, c) dissolved oxygen content, and d) chlorophyll for all years. White
lines indicate 17 °C in temperature plots, and 187 µM (6ppm) and 250 µM (8ppm) in O2 plots.
Note that the depth axis is linear in depth in the upper plots, but logarithmically scaled in the
second row of plots to highlight near-surface details (Chlorophyll plots show the logarithmic
depth scales in both sets).
a) Temperature in upper 150m of the Strait. b) 2015-2024 Anomalies from Mean Seasonal
Salinity. c) Dissolved Oxygen. d) Chlorophyll Climatology. Linear depth.
(note linear depth scale).
a) Temperature in upper 150m of the Strait. b) 2011-2024 Anomalies from Mean Seasonal
Salinity. c) Dissolved Oxygen. d) Chlorophyll Climatology. Logarithmic depth.
(note logarithmic depth scale).