Page 16 - HydrographyReadMe
P. 16

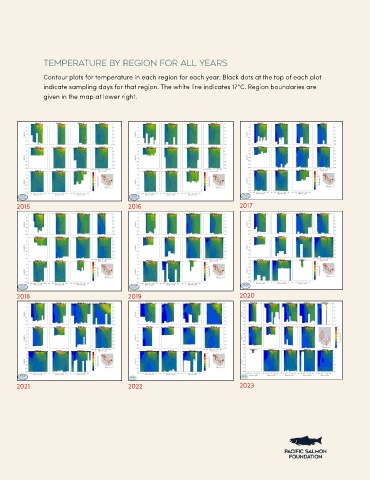
Temperature by Region for All Years

               Contour plots for temperature in each region for each year. Black dots at the top of each plot
               indicate sampling days for that region. The white line indicates 17°C. Region boundaries are
               given in the map at lower right.


       2015                                2016                                 2017


       2018                                2019                                 2020


       2021                                2022                                 2023
   11   12   13   14   15   16   17   18   19   20   21