
Page 26 - Hydrography
P. 26
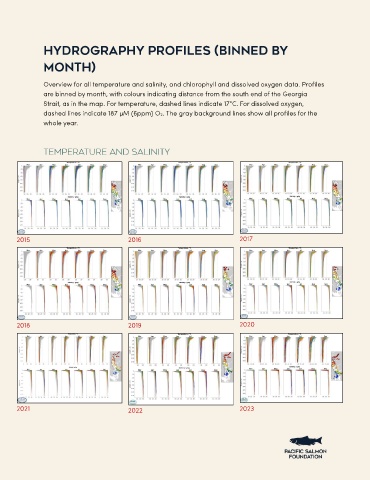
Hydrography Profiles (Binned by

               Month)


               Overview for all temperature and salinity, and chlorophyll and dissolved oxygen data. Profiles
               are binned by month, with colours indicating distance from the south end of the Georgia
               Strait, as in the map. For temperature, dashed lines indicate 17°C. For dissolved oxygen,
               dashed lines indicate 187 µM (6ppm) O2. The gray background lines show all profiles for the
               whole year.
               Temperature and Salinity


                2015                            2016                         2017


                2018                            2019                         2020


                2021                            2022                         2023


                2024