
Page 30 - Hydrography
P. 30
Time Series
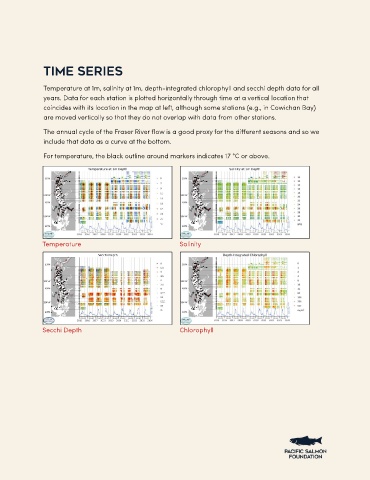
Temperature at 1m, salinity at 1m, depth-integrated chlorophyll and secchi depth data for all
years. Data for each station is plotted horizontally through time at a vertical location that
coincides with its location in the map at left, although some stations (e.g., in Cowichan Bay)
are moved vertically so that they do not overlap with data from other stations.
The annual cycle of the Fraser River flow is a good proxy for the different seasons and so we
include that data as a curve at the bottom.
For temperature, the black outline around markers indicates 17 °C or above.
Temperature Salinity
Secchi Depth Chlorophyll