
Page 2 - ZooplanktonReadMe
P. 2
Introduction
Zooplankton are the critical food web link between microscopic
plants (primary producers or phytoplankton) and juvenile fish.
Although there are hundreds of different species of zooplankton,
these can be organized into a smaller number of groups containing
similar species. The large crustacean groups presented here are
considered the preferred diet for juvenile salmon in the Strait of
Georgia.
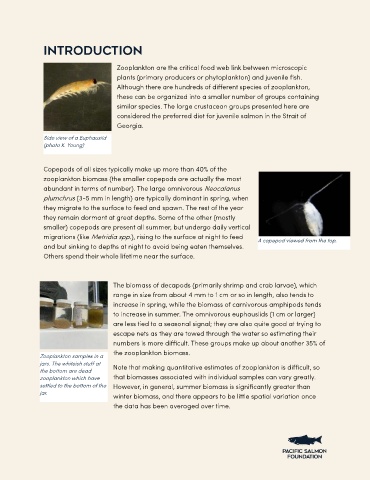
Side view of a Euphausiid
(photo K. Young)
Copepods of all sizes typically make up more than 40% of the
zooplankton biomass (the smaller copepods are actually the most
abundant in terms of number). The large omnivorous Neocalanus
plumchrus (3-5 mm in length) are typically dominant in spring, when
they migrate to the surface to feed and spawn. The rest of the year
they remain dormant at great depths. Some of the other (mostly
smaller) copepods are present all summer, but undergo daily vertical
migrations (like Metridia spp.), rising to the surface at night to feed
A copepod viewed from the top.
and but sinking to depths at night to avoid being eaten themselves.
Others spend their whole lifetime near the surface.
The biomass of decapods (primarily shrimp and crab larvae), which
range in size from about 4 mm to 1 cm or so in length, also tends to
increase in spring, while the biomass of carnivorous amphipods tends
to increase in summer. The omnivorous euphausiids (1 cm or larger)
are less tied to a seasonal signal; they are also quite good at trying to
escape nets as they are towed through the water so estimating their
numbers is more difficult. These groups make up about another 35% of
the zooplankton biomass.
Zooplankton samples in a
jars. The whiteish stuff at Note that making quantitative estimates of zooplankton is difficult, so
the bottom are dead
zooplankton which have that biomasses associated with individual samples can vary greatly.
settled to the bottom of the However, in general, summer biomass is significantly greater than
jar.
winter biomass, and there appears to be little spatial variation once
the data has been averaged over time.