
Page 10 - Hydrography
P. 10
Mean Conditions in the Strait of
Georgia
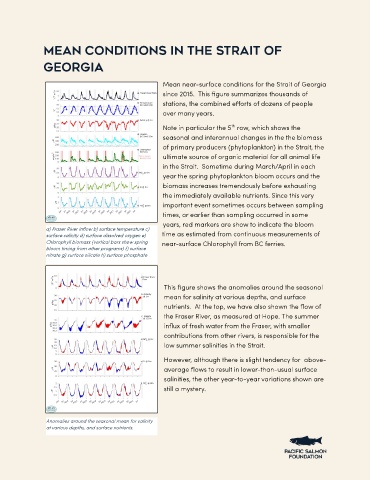
Mean near-surface conditions for the Strait of Georgia
since 2015. This figure summarizes thousands of
stations, the combined efforts of dozens of people over
many years.
th
Note in particular the 5 row, which shows the seasonal
and interannual changes in the the biomass of primary
producers (phytoplankton) in the Strait, the ultimate
source of organic material for all animal life in the
Strait. Sometime during March/April in each year the
spring phytoplankton bloom occurs and the biomass
increases tremendously before exhausting the
immediately available nutrients. Since this very
important event sometimes occurs between sampling
times, or earlier than sampling occurred in some years,
red markers are show to indicate the bloom time as
a) Fraser River inflow b) surface temperature c)
surface salinity d) surface dissolved oxygen e) estimated from continuous measurements of near-
Chlorophyll biomass (vertical bars show spring surface Chlorophyll from BC ferries.
bloom timing from other programs) f) surface
nitrate g) surface silicate h) surface phosphate
This figure shows the anomalies around the seasonal
mean for salinity at various depths, and surface
nutrients. At the top, we have also shown the flow of the
Fraser River, as measured at Hope. The summer influx
of fresh water from the Fraser, with smaller contributions
from other rivers, is responsible for the low summer
salinities in the Strait.
However, although there is slight tendency for above-
average flows to result in lower-than-usual surface
salinities, the other year-to-year variations shown are
still a mystery.
Anomalies around the seasonal mean for salinity
at various depths, and surface nutrients.