
Page 11 - Hydrography
P. 11
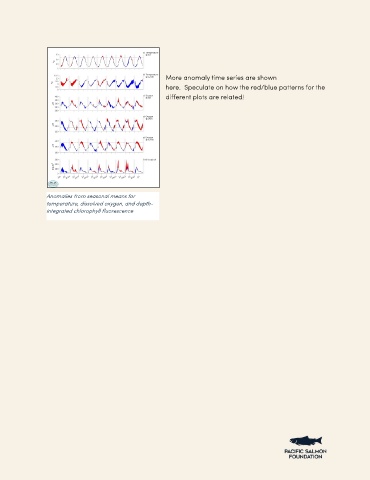
More anomaly time series are shown here.  Speculate
                                                     on how the red/blue patterns for the different plots are

                                                     related!


               Anomalies from seasonal means for
               temperature, dissolved oxygen, and depth-
               integrated chlorophyll fluorescence