
Page 5 - Hydrography
P. 5
Hydrography Methods and
Evaluation of Data Quality
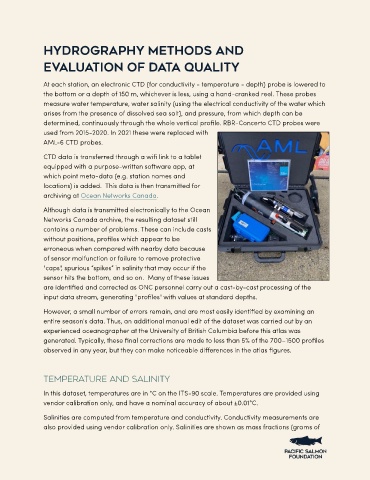
At each station, an electronic CTD (for conductivity - temperature - depth) probe is lowered to
the bottom or a depth of 150 m, whichever is less, using a hand-cranked reel. These probes
measure water temperature, water salinity (using the electrical conductivity of the water which
arises from the presence of dissolved sea salt), and pressure, from which depth can be
determined, continuously through the whole vertical profile. RBR-Concerto CTD probes were
used from 2015-2020. In 2021 these were replaced with
AML-6 CTD probes.
CTD data is transferred through a wifi link to a tablet
equipped with a purpose-written software app, at
which point meta-data (e.g. station names and
locations) is added. This data is then transmitted for
archiving at Ocean Networks Canada.
Although data is transmitted electronically to the Ocean
Networks Canada archive, the resulting dataset still
contains a number of problems. These can include casts
without positions, profiles which appear to be
erroneous when compared with nearby data because
of sensor malfunction or failure to remove protective
"caps", spurious “spikes” in salinity that may occur if the
sensor hits the bottom, and so on. Many of these issues
are identified and corrected as ONC personnel carry out a cast-by-cast processing of the
input data stream, generating "profiles" with values at standard depths.
However, a small number of errors remain, and are most easily identified by examining an
entire season's data. Thus, an additional manual edit of the dataset was carried out by an
experienced oceanographer at the University of British Columbia before this atlas was
generated. Typically, these final corrections are made to less than 5% of the 700–1500 profiles
observed in any year, but they can make noticeable differences in the atlas figures.
Temperature and Salinity
In this dataset, temperatures are in °C on the ITS-90 scale. Temperatures are provided using
vendor calibration only, and have a nominal accuracy of about ±0.01°C.
Salinities are computed from temperature and conductivity. Conductivity measurements are
also provided using vendor calibration only. Salinities are shown as mass fractions (grams of