
Page 6 - Hydrography
P. 6
sea salt per kilogram of seawater) on the TEOS-10 Reference Composition Salinity Scale with
a nominal accuracy of ±0.01 g/kg. Salinities on the older Practical Salinity Scale 1978 (PSS78),
which are sometimes indicated with the label "PSU", are numerically smaller than Reference
Salinities by a factor of about 0.9953; the difference is usually indistinguishable in figures.
Chlorophyll
The CTD profilers are also equipped with an extra sensor (a Turner Cyclops 7F Fluorometer) to
measure a fluorescence signal arising from concentrations of chlorophyll in the water
column. Chlorophyll concentrations, in units of micrograms of chlorophyll per liter of
seawater, are nominal and based on factory calibrations only, which are carried out using a
particular chlorophyll standard. However, the response of live phytoplankton, when measured
in-situ, often differs from this factory standard. A common heuristic is that such
measurements are accurate within a factor or two, and this appears to be true for
measurements in the Strait of Georgia.
As part of the sampling plan, each patrol also obtains particulate matter from duplicate water
samples obtained from a depth of 5 m at one station in each survey. A fixed volume of sample
water is passed through a glass-fibre filter with a nominal pore size of 1.2 µm, so that all
larger particles, which include phytoplankton containing chlorophyll, are retained. This sample
is then analyzed in the laboratory for the actual amount of Chlorophyll at that depth.
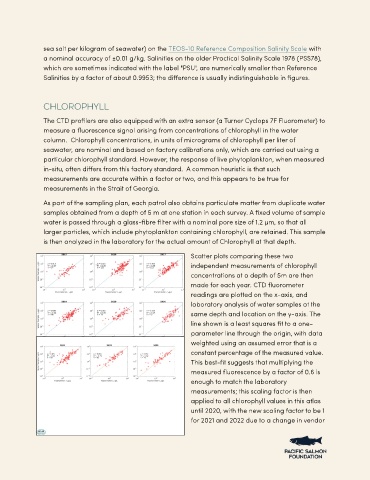
Scatter plots comparing these two
independent measurements of chlorophyll
concentrations at a depth of 5m are then
made for each year. CTD fluorometer
readings are plotted on the x-axis, and
laboratory analysis of water samples at the
same depth and location on the y-axis. The
line shown is a least squares fit to a one-
parameter line through the origin, with data
weighted using an assumed error that is a
constant percentage of the measured value.
This best-fit suggests that multiplying the
measured fluorescence by a factor of 0.6 is
enough to match the laboratory
measurements; this scaling factor is then
applied to all chlorophyll values in this atlas
until 2020, with the new scaling factor to be 1
for 2021 and 2022 due to a change in vendor