RESILIENT COASTS FOR SALMON SPOTLIGHT COMMUNITIES
Comox Valley
The area of focus for this spotlight report is the unceded Traditional Territory of the K’ómoks First Nation, colonially known as Comox Valley, on central eastern Vancouver Island. Specifically, This report covers the area within the administrative boundaries of the Comox Valley Regional District whose shoreline stretches 102km.
The K’ómoks Nation is an amalgamation of several formerly distinct tribes, including the Sathloot, Sasitla, Ieeksen, Xa’xe, and Pentlatch, each with its own history and cultural connections. Collectively, these tribes have been the “care takers of the ‘land of plenty’ since time immemorial” (K’ómoks First Nation 2021).

Key Findings
Shoreline Modifications
Man-made structures like seawalls and riprap, often built to protect shoreline infrastructure, can actually exacerbate erosion by redirecting wave energy to nearby areas. These modifications also remove key intertidal habitats and food sources essential for the growth and survival of juvenile salmon and forage fish. By stripping away the natural complexity of coastal ecosystems, shoreline modifications reduce their capacity to support biodiversity and adapt to rising sea levels.
Extent of shoreline modification
As of 2024, approximately 48.3km of the Comox Valley shoreline is modified, while 51.6km remains natural. This indicates that roughly 48% of the community’s shoreline is classified as modified – Figure 1.
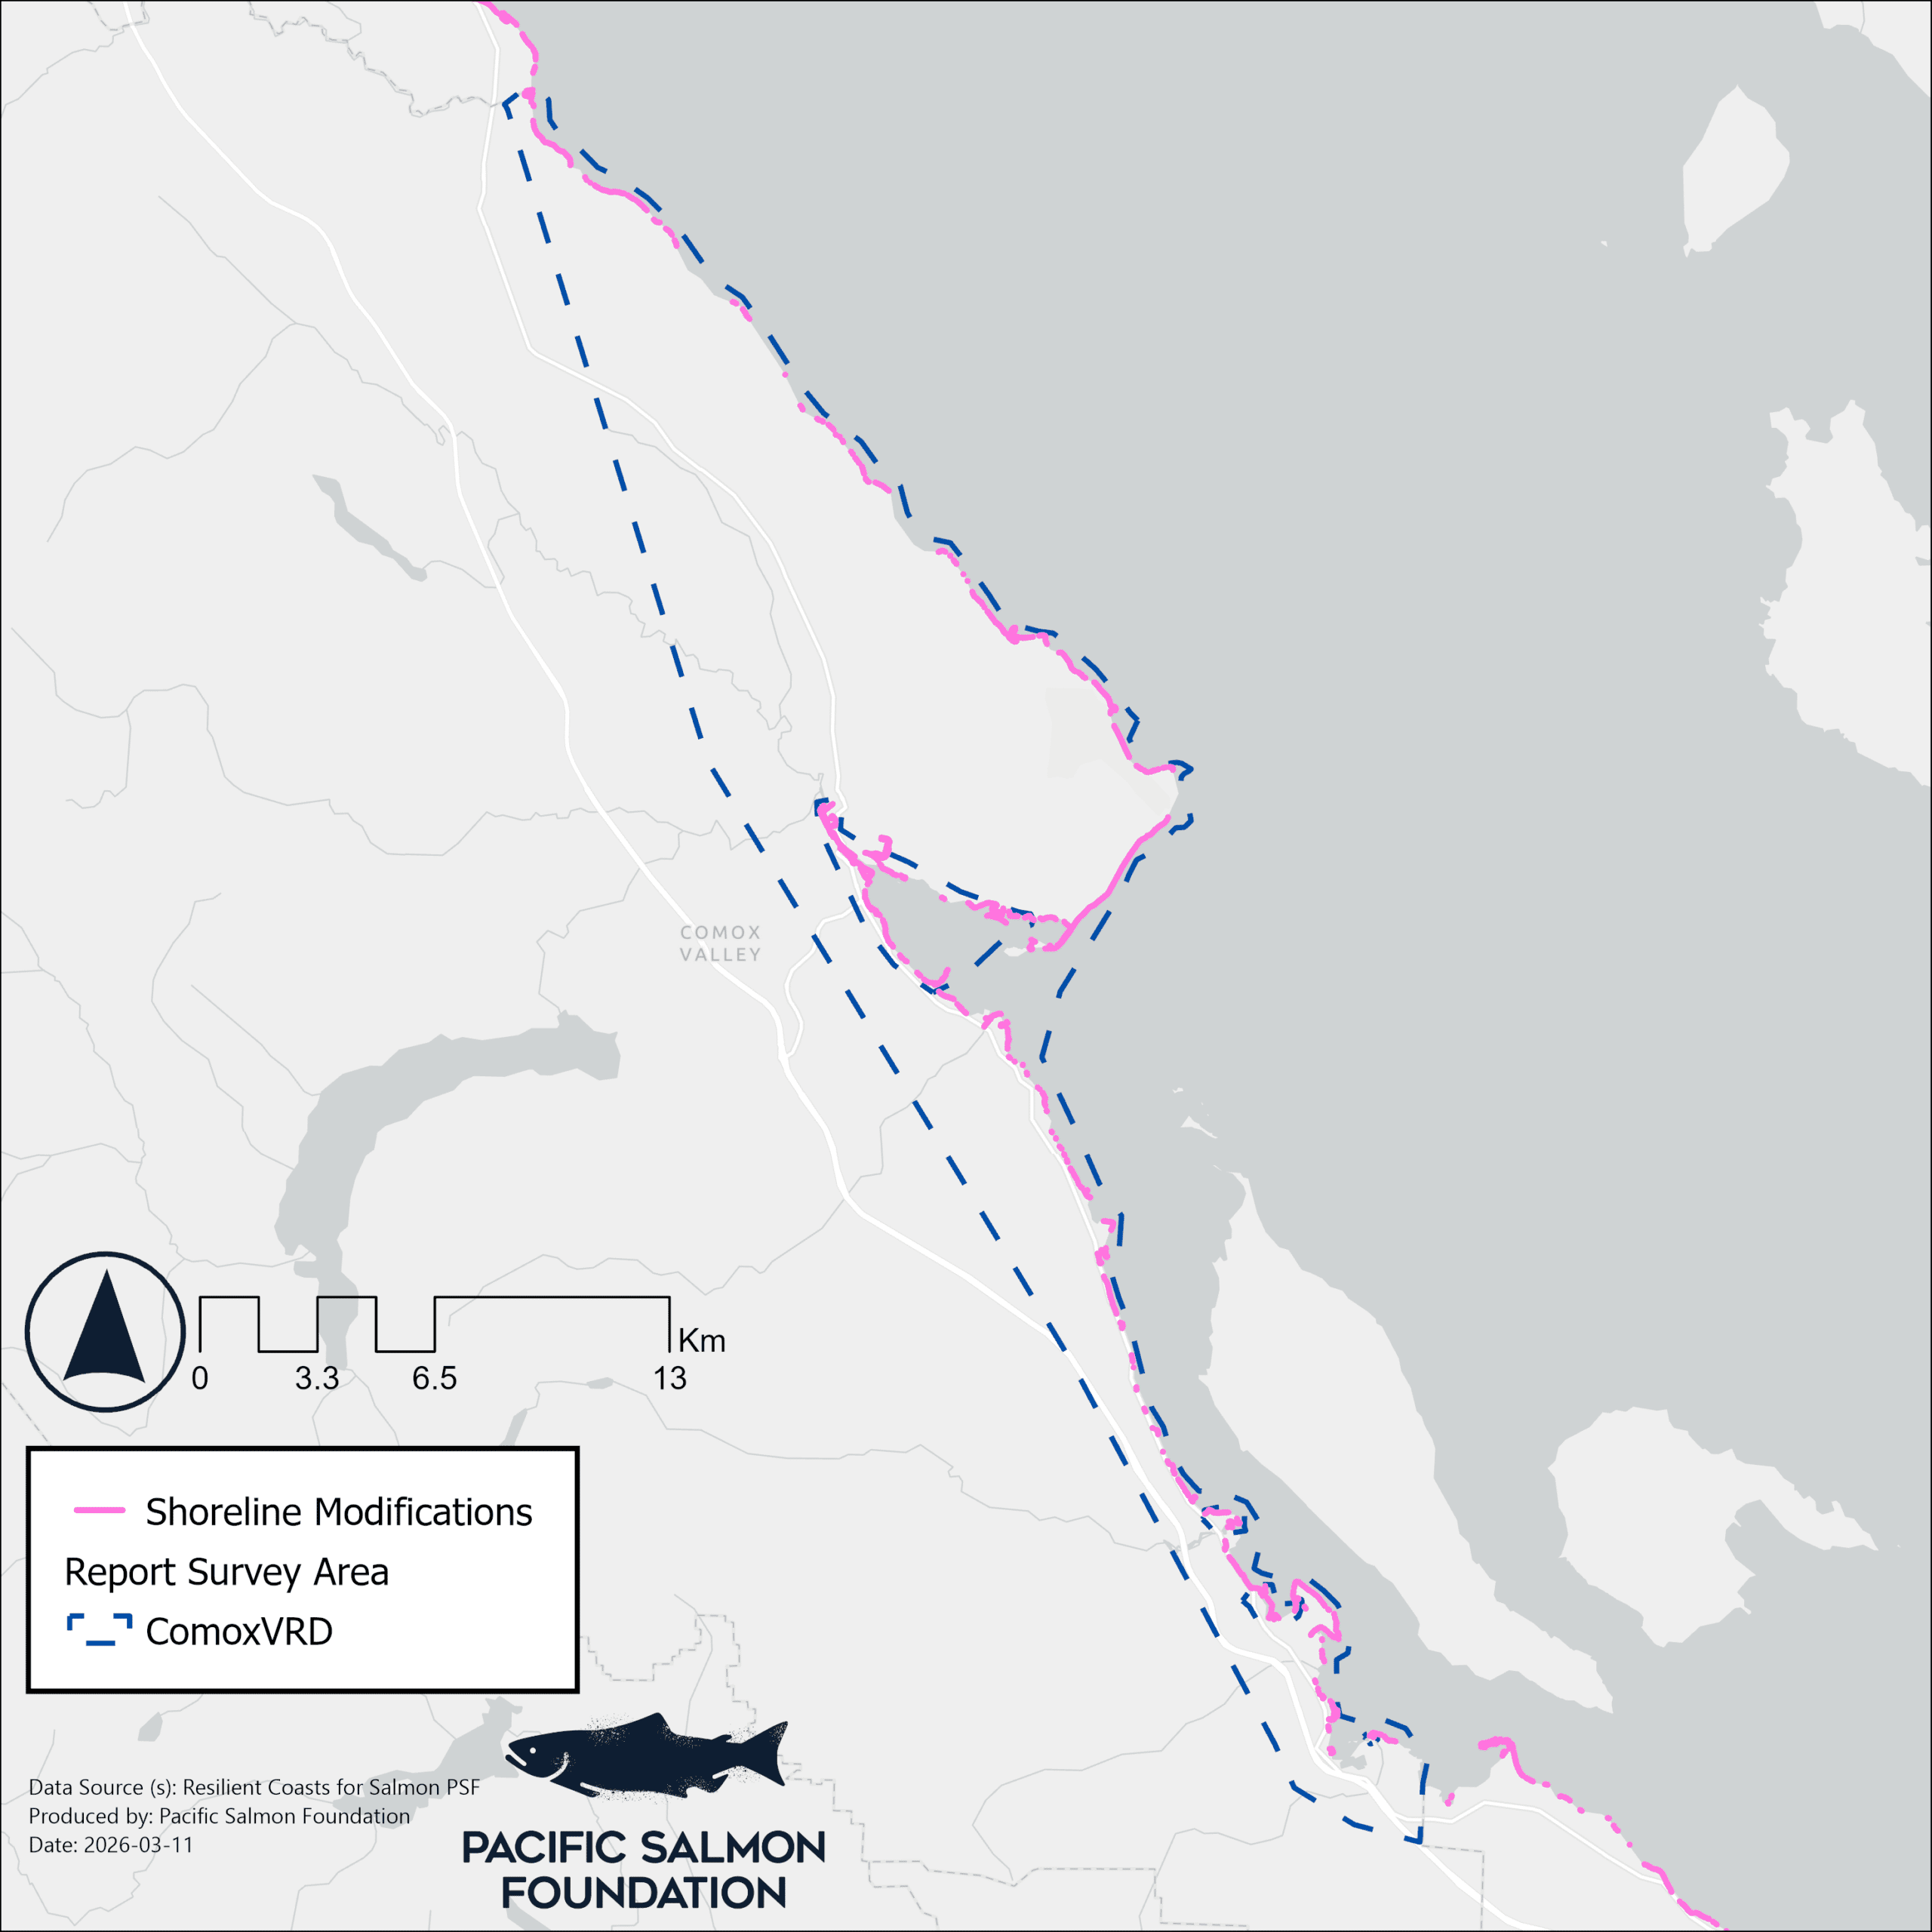
Figure 1. Coastal modifications (shown in pink) with the extent of data collection outlined by blue dashes (all of the Comox Valley Regional District).
Most common shoreline modification types
The most common modification types were riprap (36%), other (35%), and seawalls/bulkheads (14%) – see Figure 2. Explore the comments in the features on the interactive map to learn more about the modification features marked ‘other’.

Figure 2. The percentage of modified shoreline by modification type.
Most common materials used in shoreline modifications
The type of material most utilized for shoreline modification was rock (37.3), undefined (18.8%), and concrete (18.6%) – see Table 1. The unknown/undefined categories indicate that the recorder was not able to determine the material that was used, due to issues with image clarity or obstruction, or in cases when a mix of materials were used. For feature materials deemed ‘undefined’ the recorded typically noted some details about the potential material in the comments section of that feature.
Table 1. The percentage of modifications, based on the type of material used in the modifications.
| Material | Percentage of Modifications |
| rock | 37.3% |
| undefined (see comments) | 18.8% |
| concrete | 18.6% |
| unknown | 15.9% |
| wood | 6.4% |
| masonry | 1.4% |
| metal | 1.2% |
| creosote/treated wood | 0.4% |
Overwater Structures
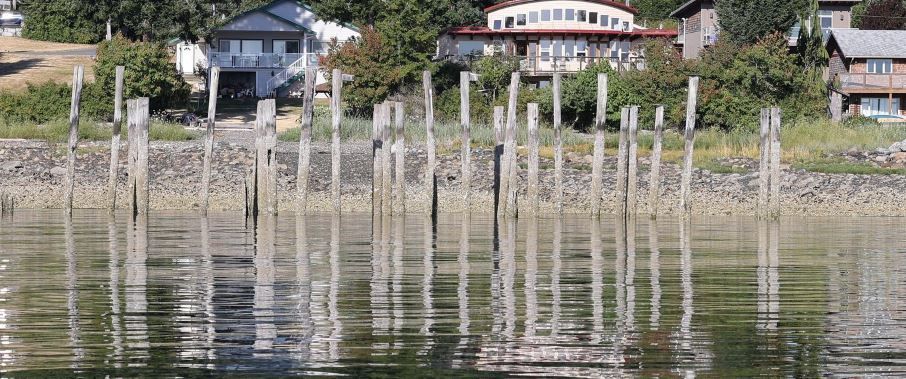
Overwater structures, like docks and piers, cast heavy shade that degrades nearshore habitat. Juvenile salmon avoid these shaded areas, which alters their natural foraging and migration patterns by forcing them into deeper waters. There, they expend more energy and face greater predation risk. The reduced light also limits the growth of essential habitats like eelgrass and algae, along with the diverse communities they support.
Number of overwater structures total and by type
The total number of overwater structures in the Comox Valley Regional District is 49, consisting primarily of individual or groupings of creosote pilings (16), residential/private docks (14), piers/boardwalks or wharfs (7), and marinas (3 large, 4 small) – see Figures 3 and 4.
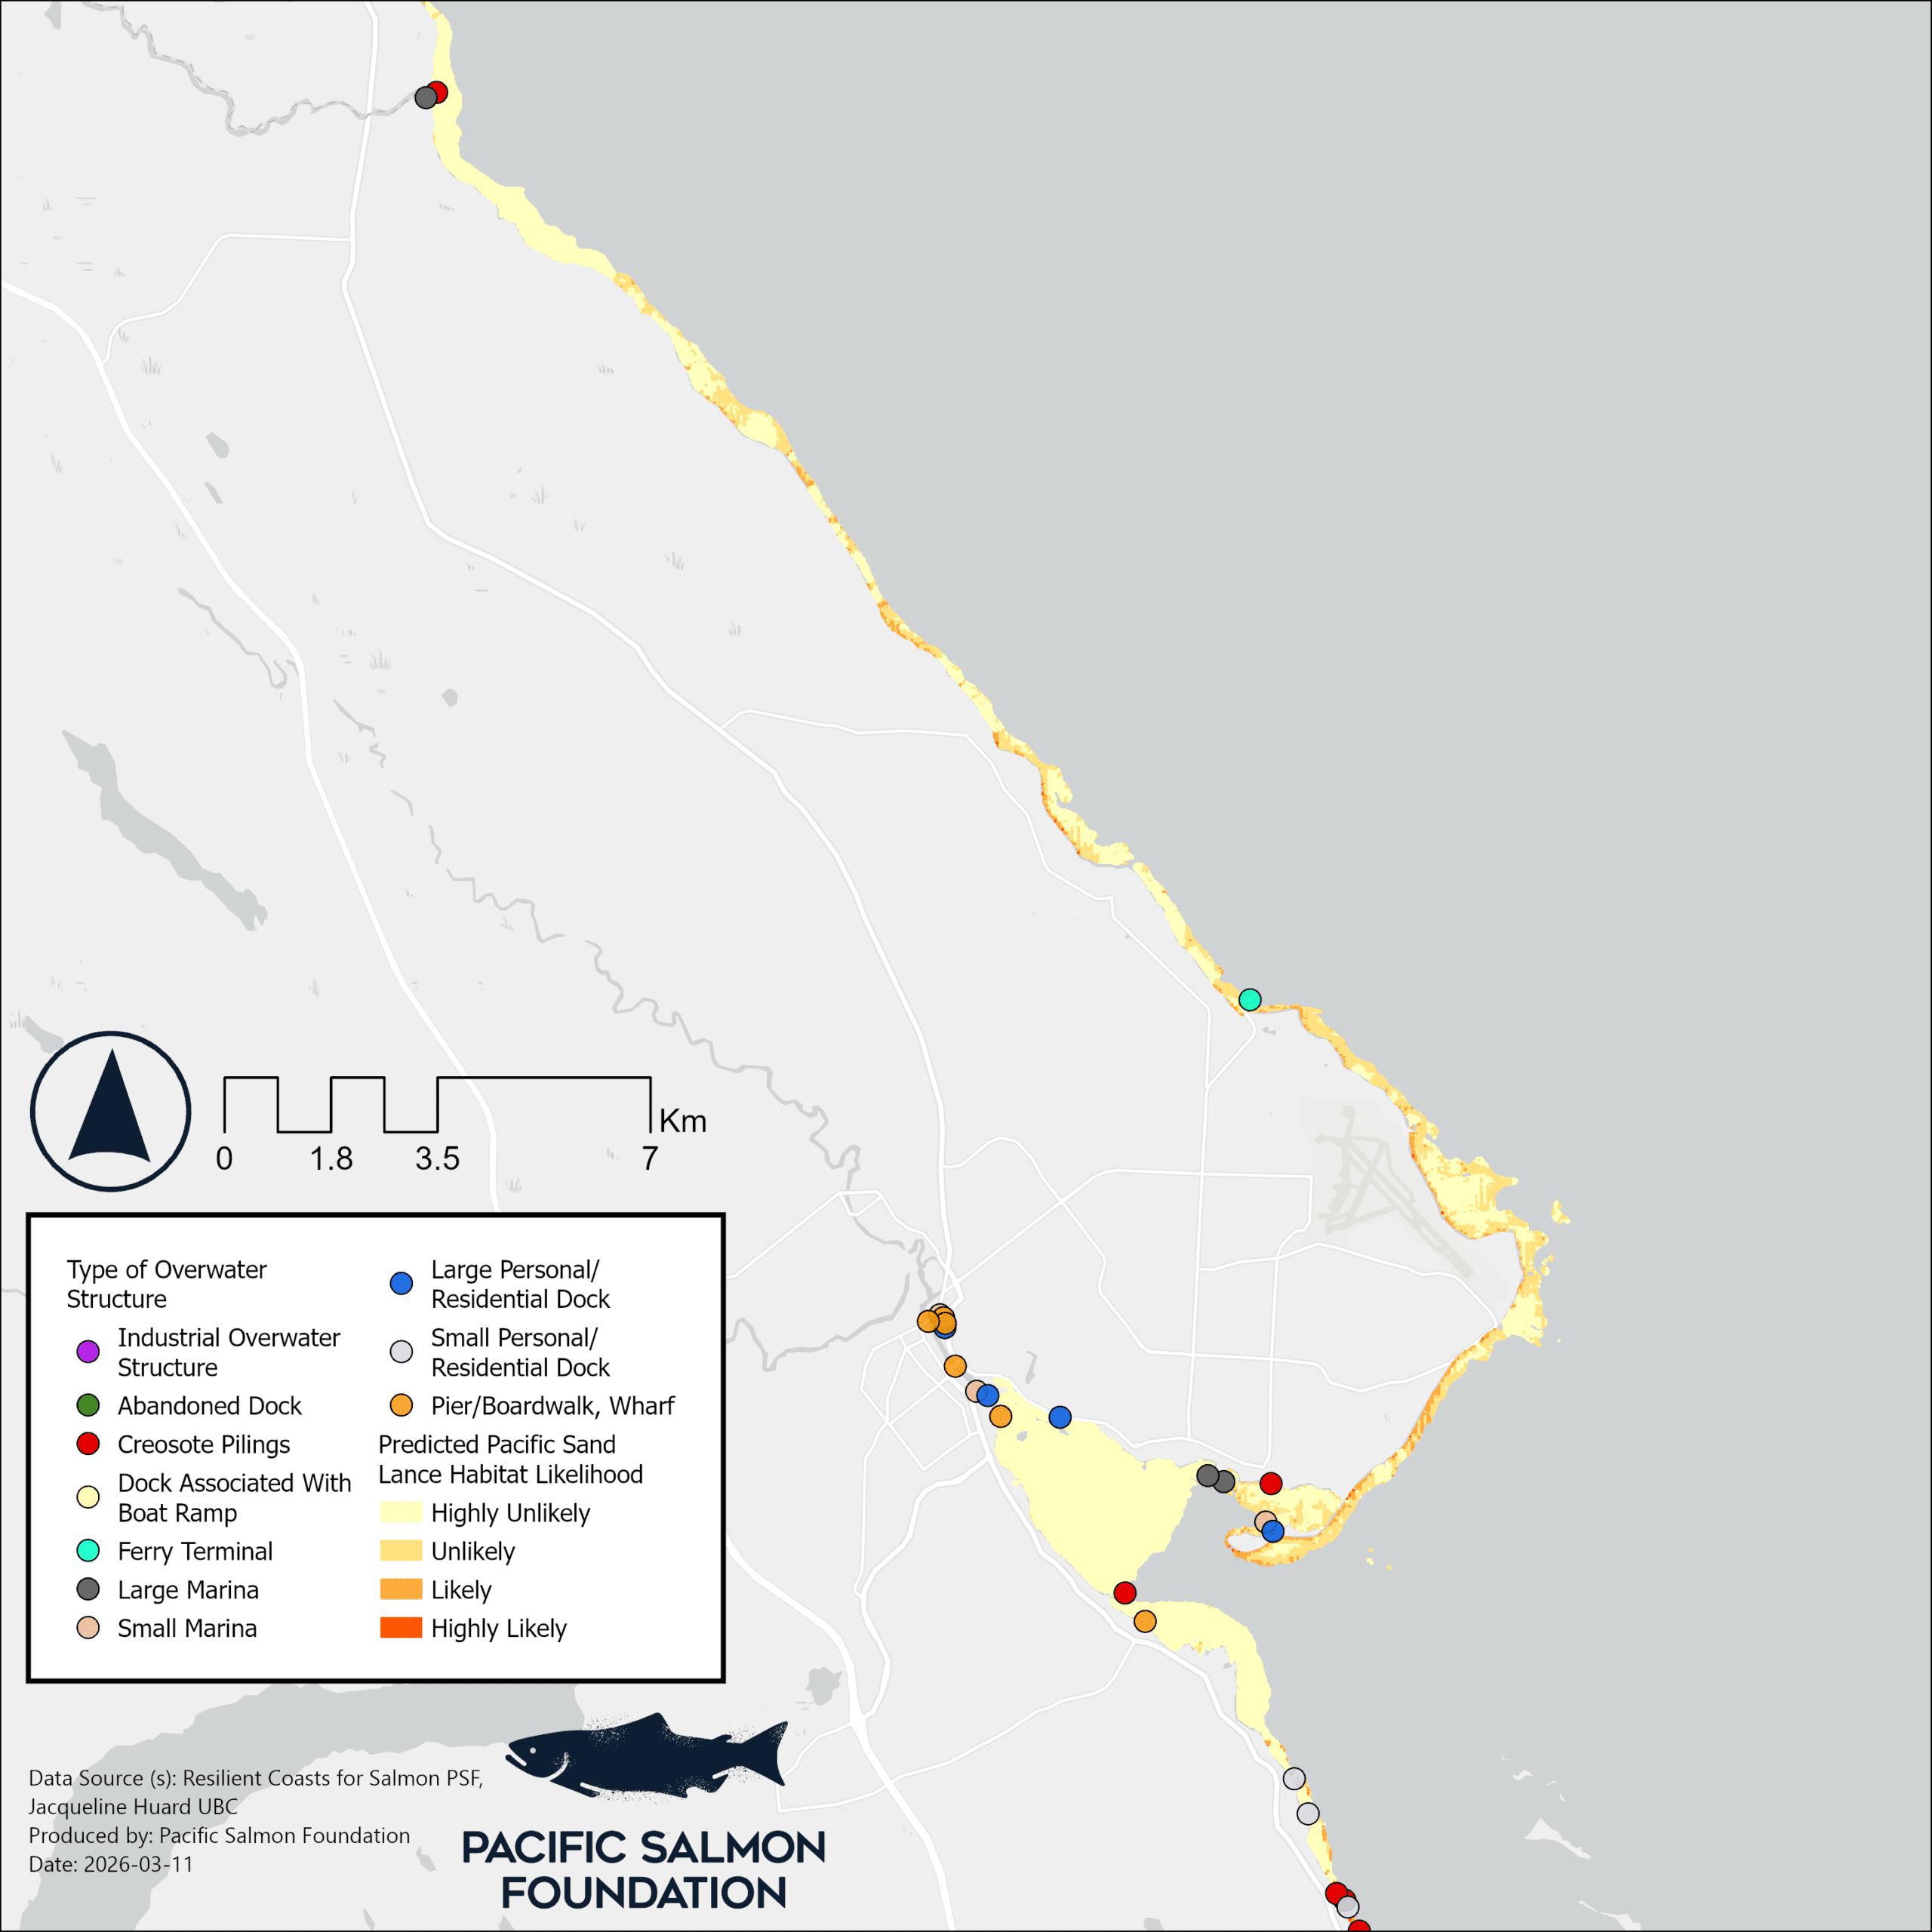
Figure 3. The extent of overwater structures within the northern half of Comox Valley Regional District, overlaid with a model of predicted Pacific sand lance spawning habitat (Huard 2022).
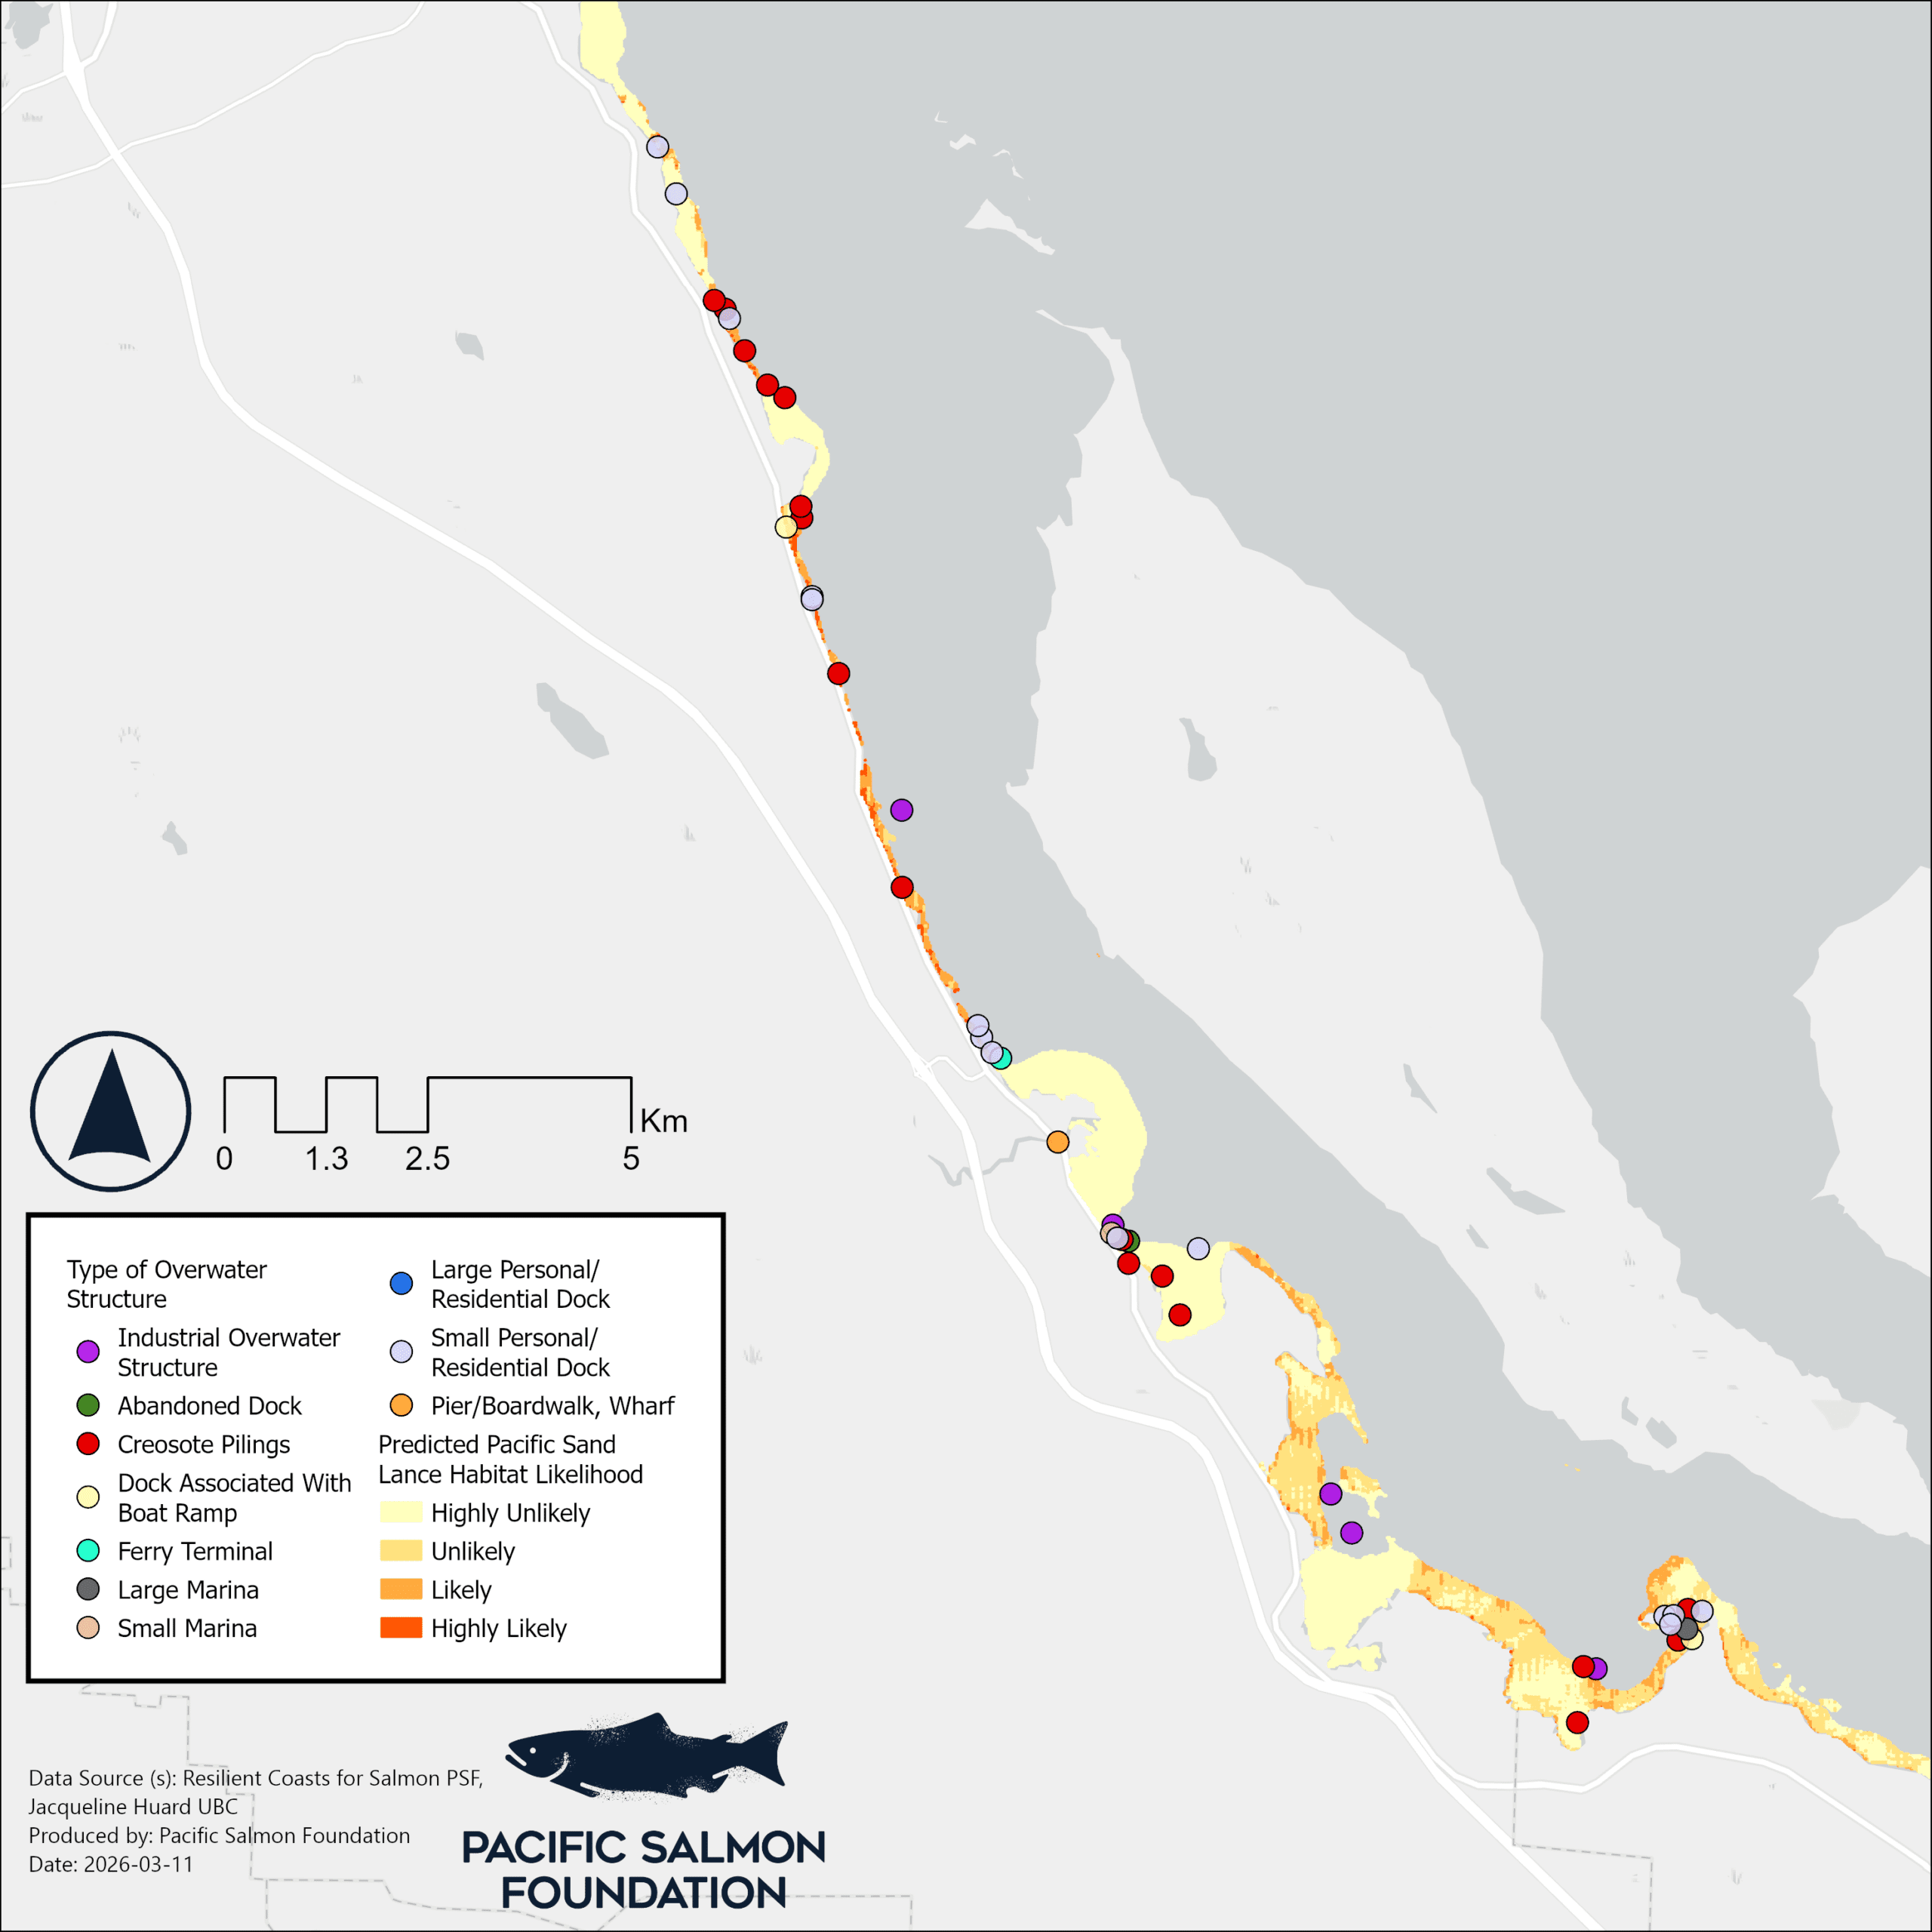
Figure 4. The extent of overwater structures within the southern half of Comox Valley Regional District, overlaid with a model of predicted Pacific sand lance spawning habitat (Huard 2022).
Log Accumulation
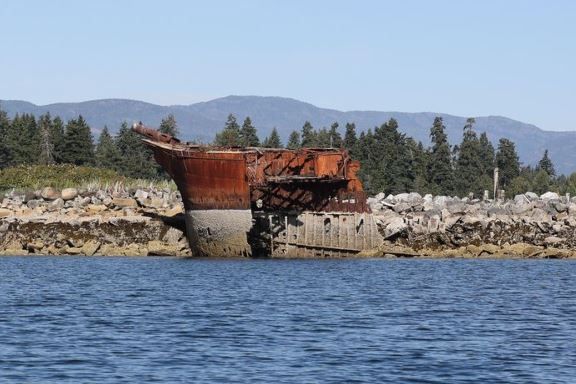
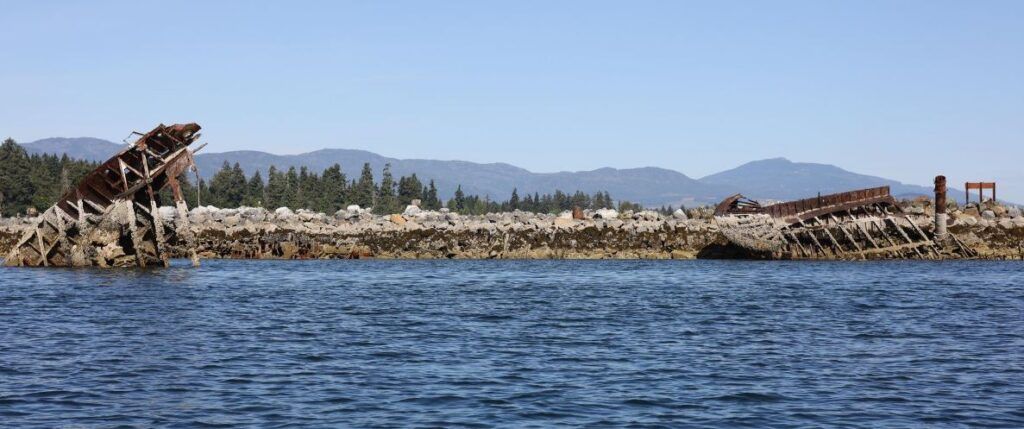
While logs are a natural part of coastal ecosystems, the escape of modified logs from log booms is leading to excessive accumulation. These logs can scour beaches, altering sediment composition and smothering nearshore vegetation. Unlike natural logs, modified logs are stripped of root balls and branches, making them unstable and prone to rolling across critical habitats that juvenile salmon and forage fish rely on for growth, food, and shelter.
For the results below, about 30% (30km) of the shoreline was not digitized for log accumulation either due to lack of shoreline imagery or it being First Nation reserve land.
Extent of log accumulation
Of the total shoreline, 30% or 31.1km of the shoreline had a moderate to extreme accumulation (20-100% beach coverage) of logs. The majority (40% or 41.4 km) of the shoreline though was categorized as having a low accumulation of logs (<20%) see Table 2 and Figures 5 and 6. It should be noted that the moderate log accumulation category also represents a significant coverage of logs – whereby 20-49% log coverage on a given beach could negatively impact shoreline habitat.
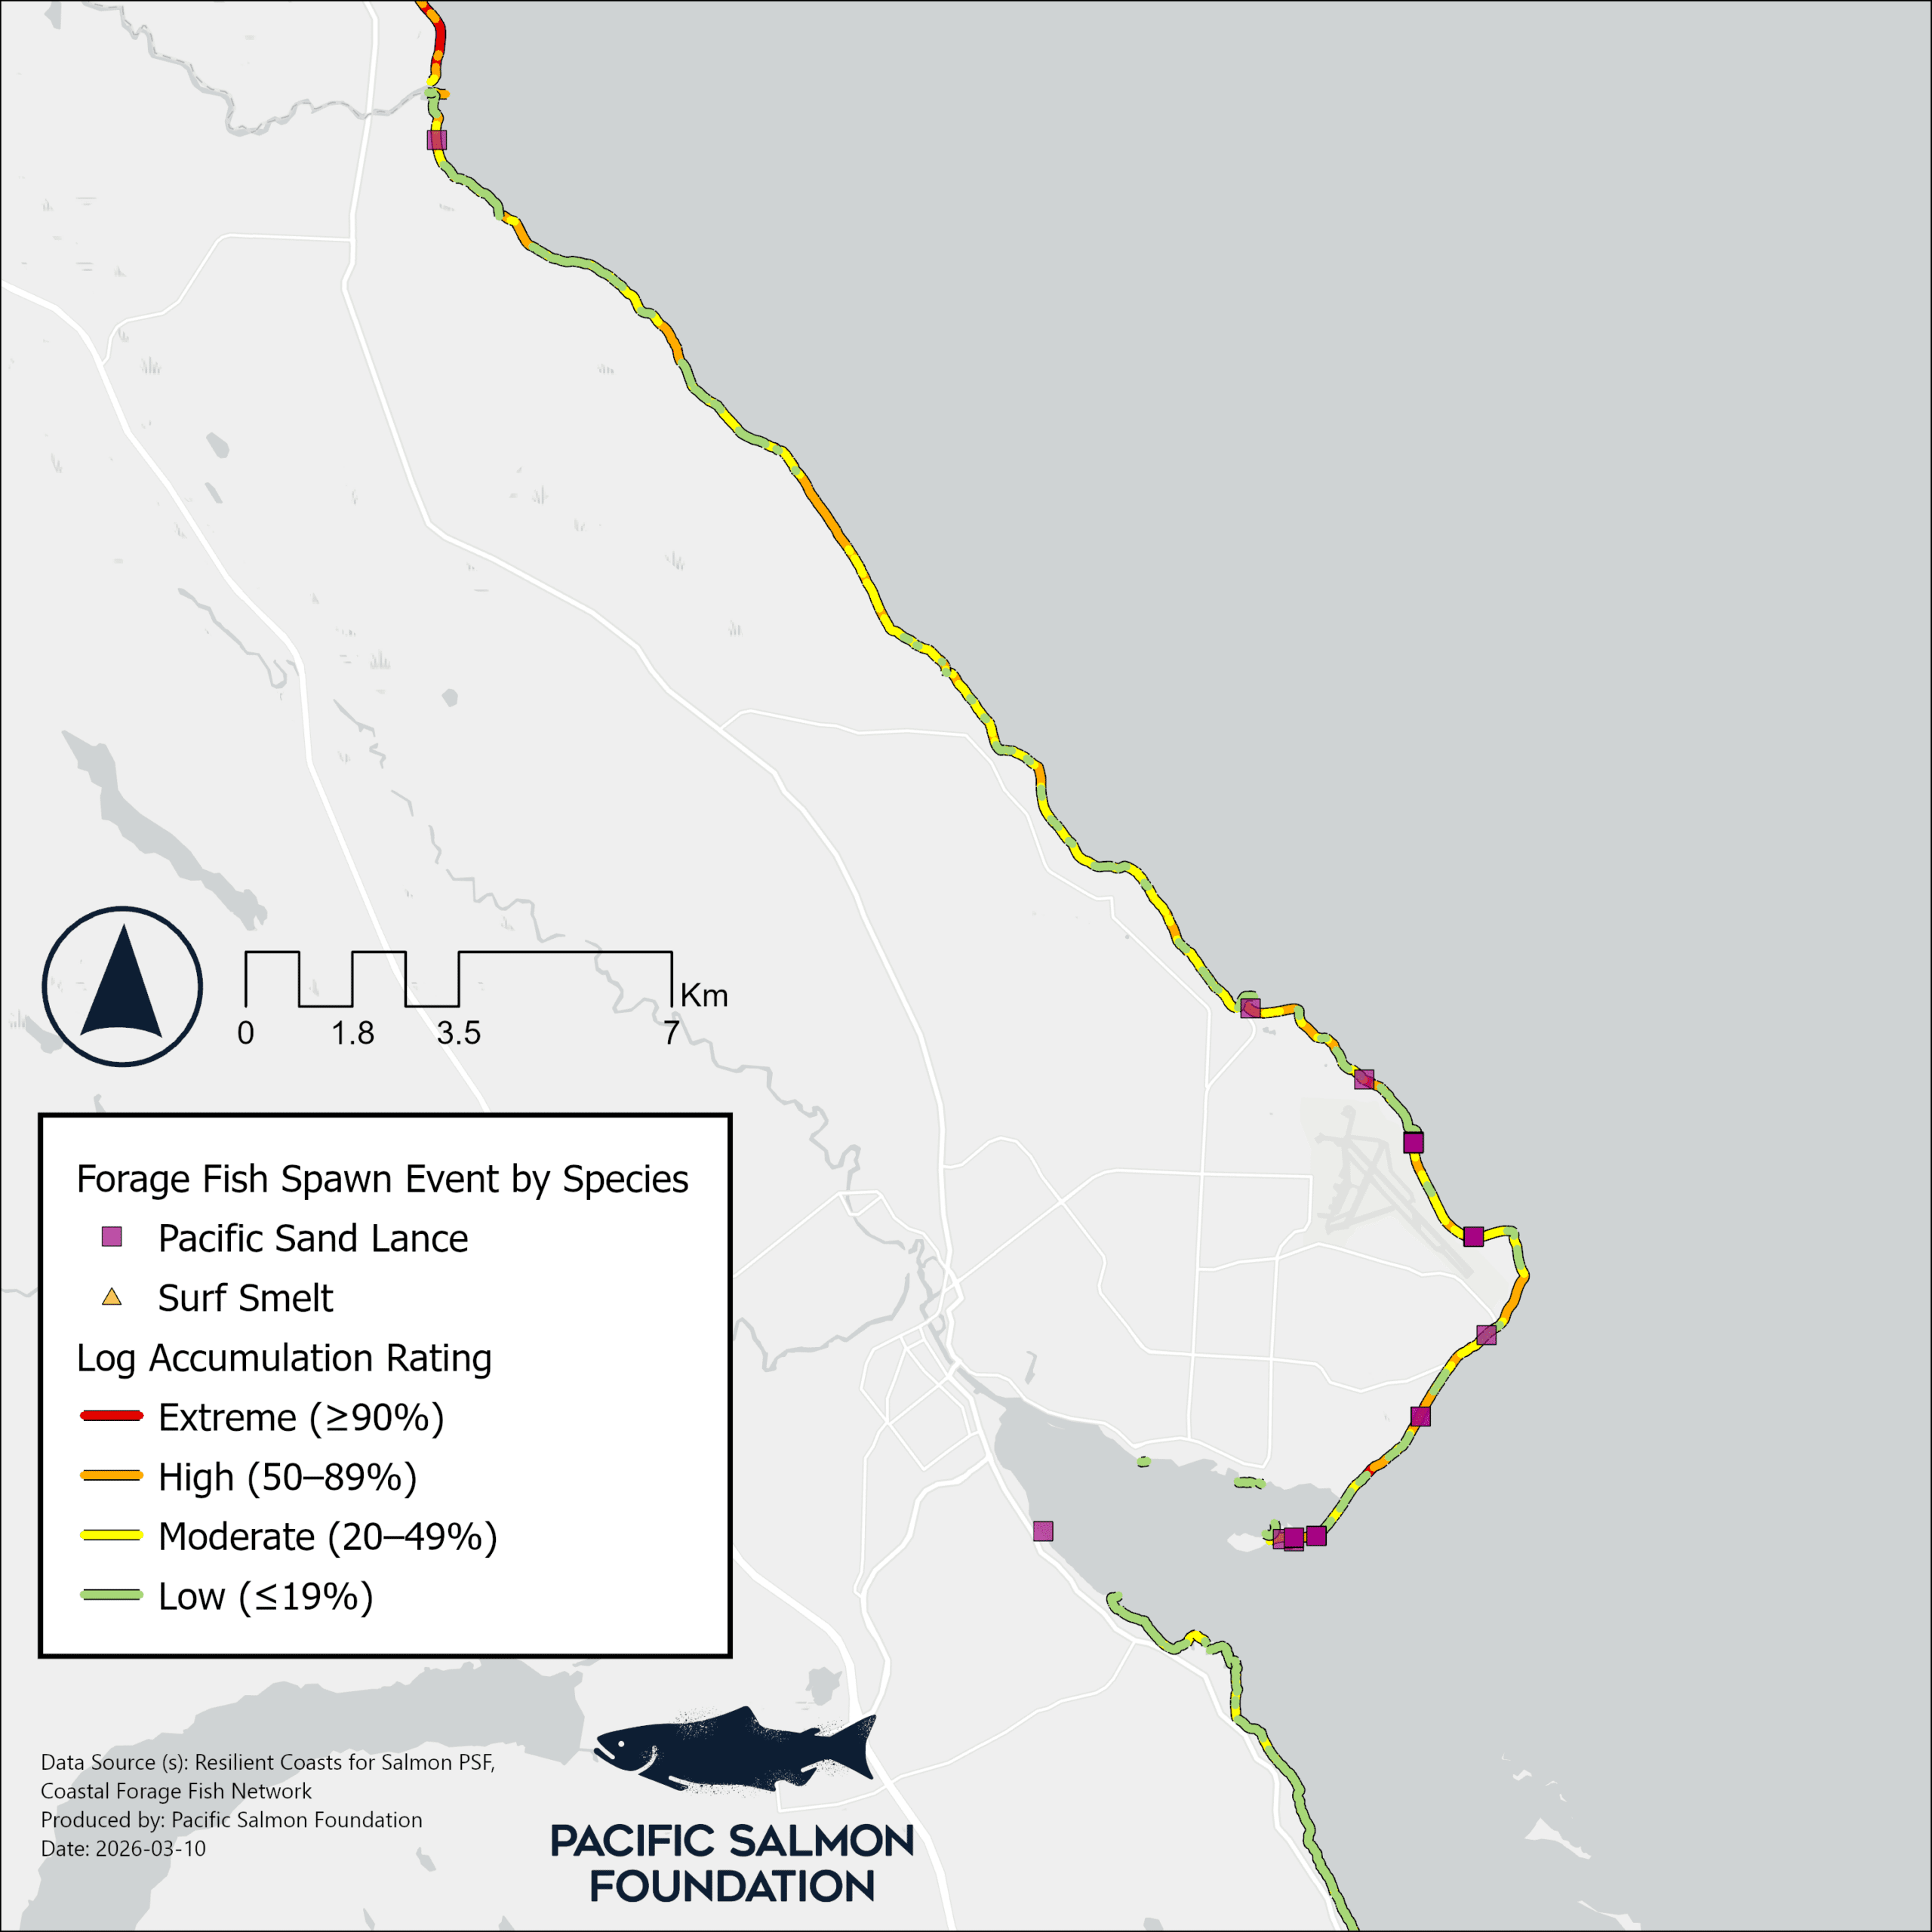
Figure 5. Log accumulation in the northern half of the Comox Valley Regional District, overlaid with monitoring efforts by the Coastal Forage Fish Network.
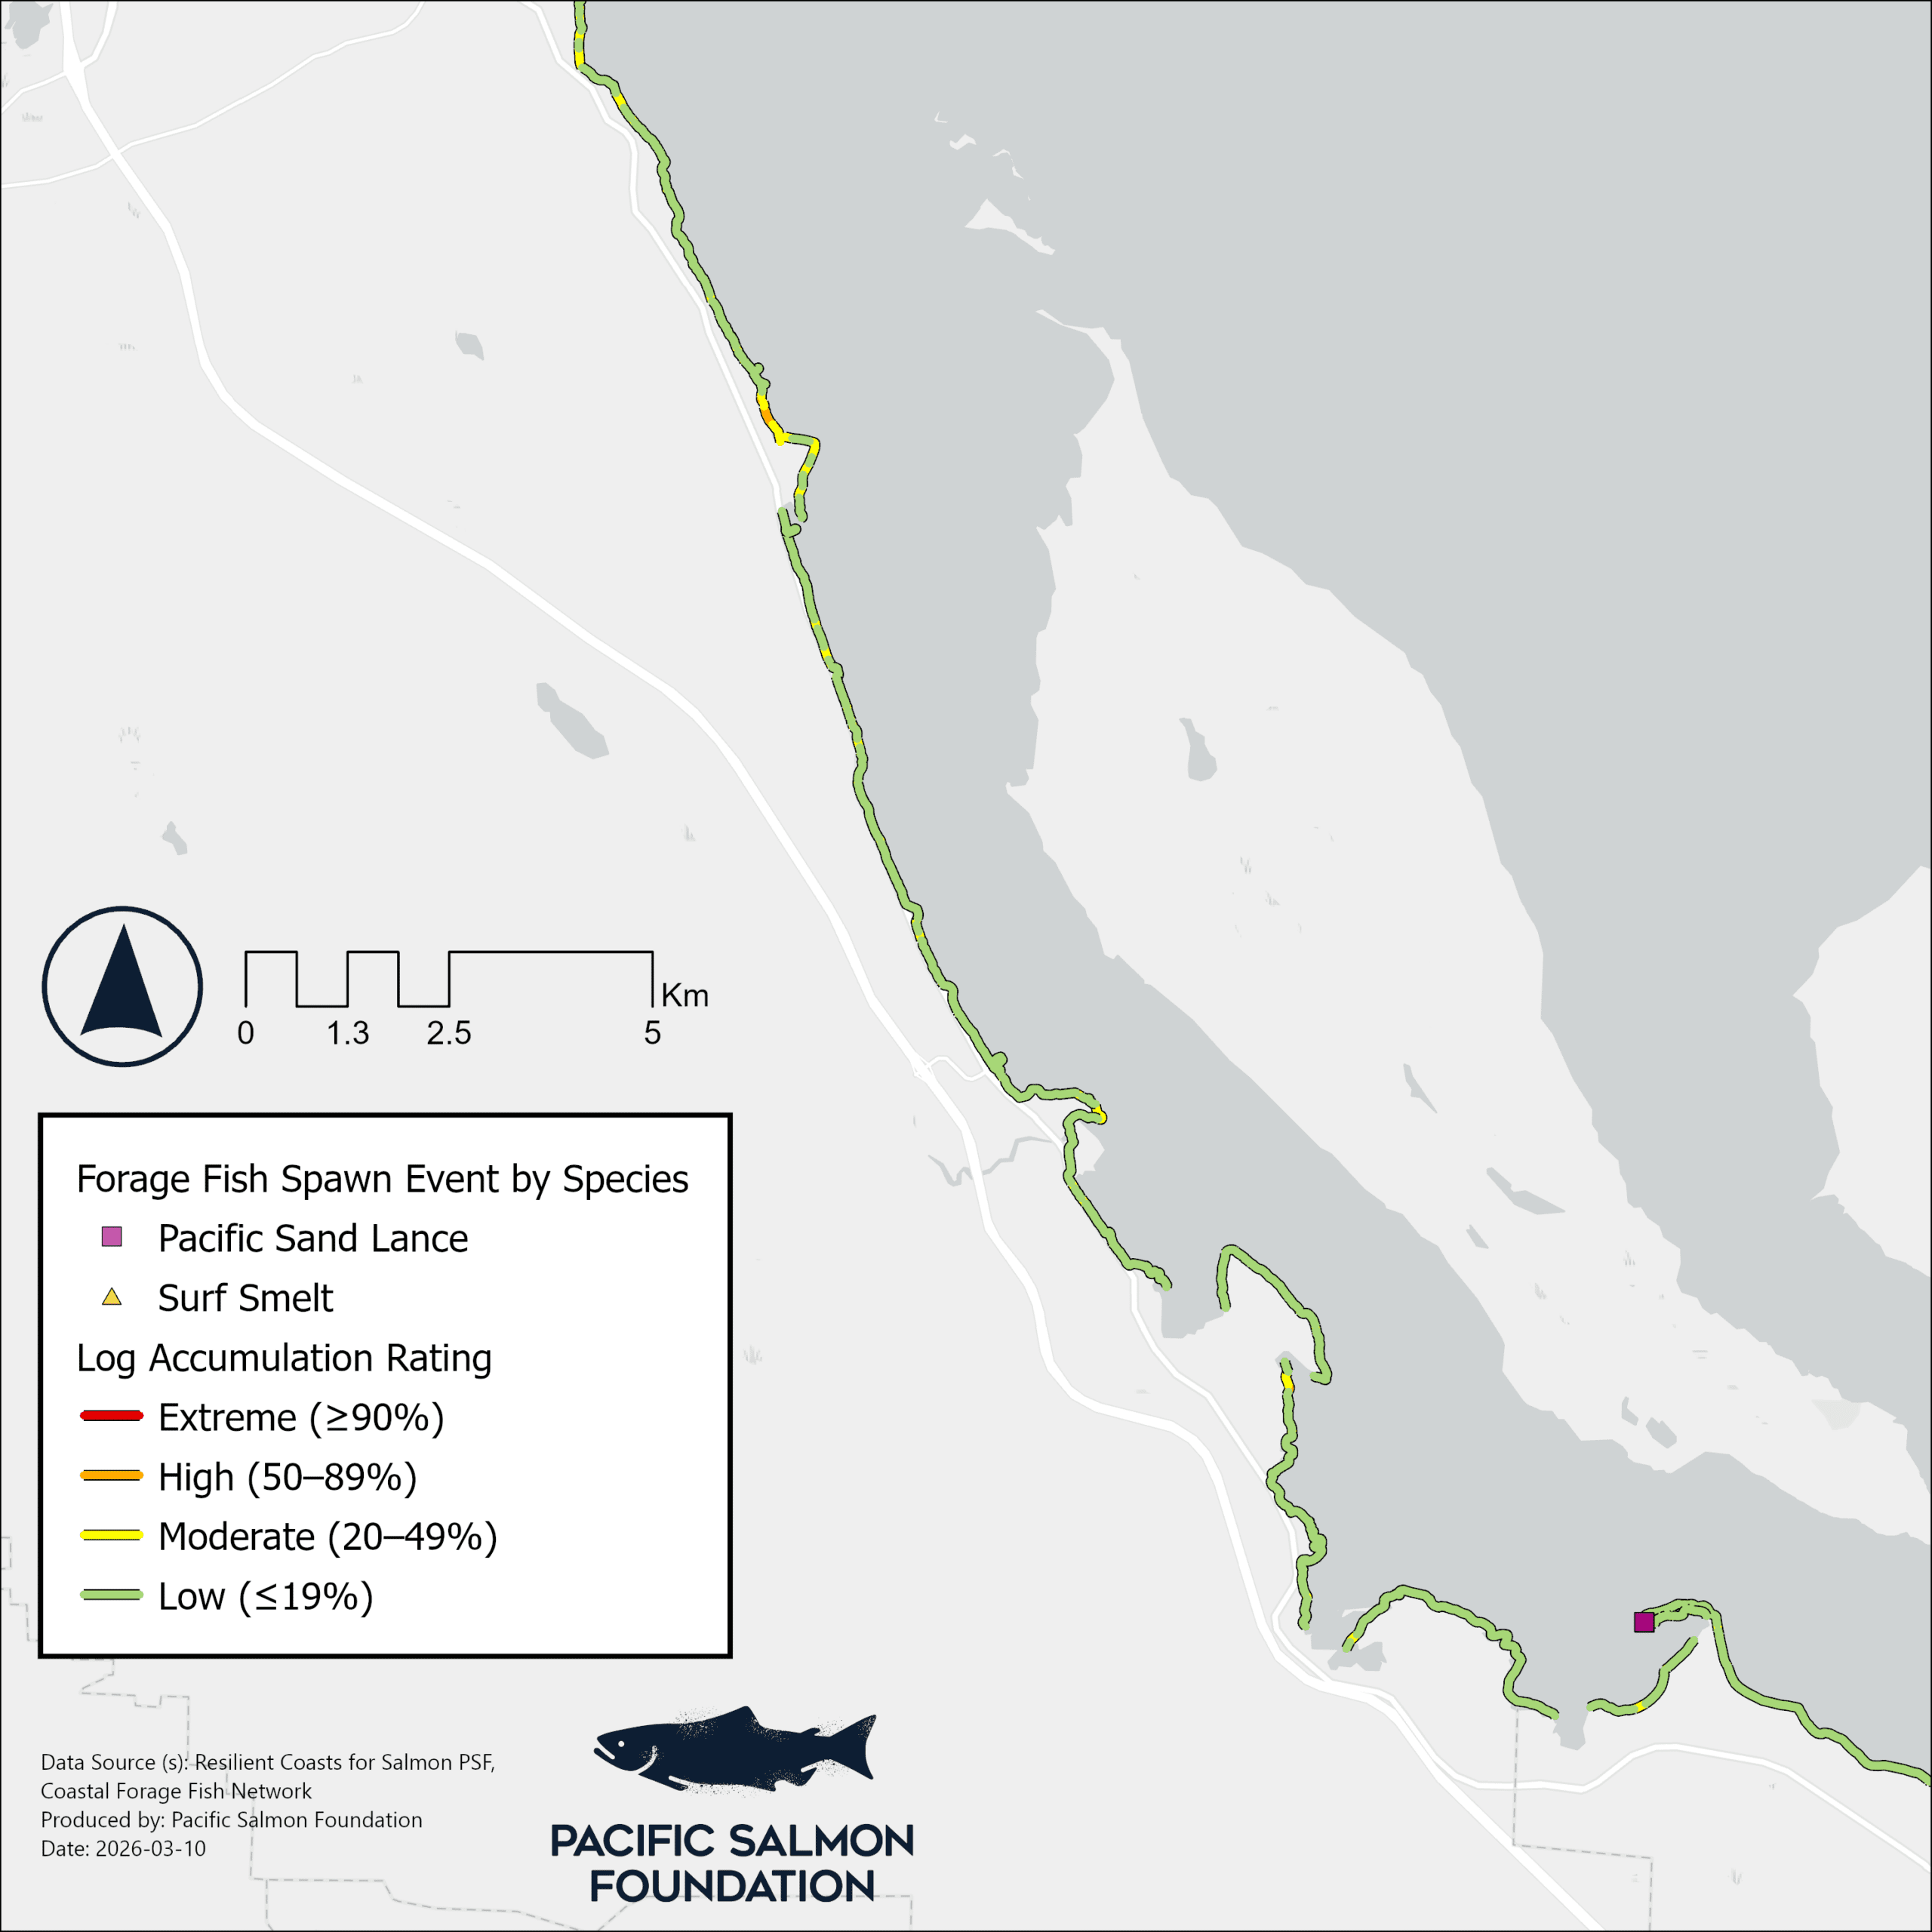
Figure 6. Log accumulation in the southern half of the Comox Valley Regional District, overlaid with monitoring efforts by the Coastal Forage Fish Network.
Table 2. The length of shoreline (in percentage and metres) by category of log accumulation.
| Log Accumulation | Percentage of Shoreline | Metres |
| Extreme (>89%) | 1 | 1,205 |
| High (50 to 89%) | 12 | 12,658 |
| Moderate (20 to 49%) | 17 | 17,253 |
| Low/None (<20%) | 40 | 41,386 |
| Unknown | 30 | 30,224 |
Mobility of logs
In terms of log mobility, the majority (56% or 57886m) of the shoreline had both anchored and mobile logs, and another 10% (10611m) had mobile logs – see Figure 7.

Figure 7. Mobility of logs within the Comox Valley Regional District.
Click the sections below to explore details about the intended use of the data, how the data were analyzed, as well as some limitations and considerations in using the data. For additional information on the methodologies undertaken to produce these results, please review the digitization protocol or contact . Scroll to below the white box to see more static maps of the community.
The Resilient Coasts for Salmon team developed protocols, collected and digitized data on coastal modifications for much of the east coast of Vancouver Island. This was prompted by community groups and researchers expressing the need for facilitating informed decision-making for adapting to coastal climate change with nature in mind, to highlight vulnerable areas to explore further with coastal geomorphologists and encourage communities to opt for precautionary approaches to shoreline management that can continue to support communities and natural systems. Digitization protocols were developed for 1. modifications present on the shoreline (hard armouring like seawalls), 2. overwater structures and pilings (e.g., docks), and 3. log accumulation, yielding three corresponding datasets.
The reporting and results are intended for educational purposes only, to share basic information and context regarding shoreline modifications and how they overlap with basic climate models and other ecological data. While it may highlight areas of concern, it is not a comprehensive assessment or risk inventory. The content should not be used for detailed analysis or decision-making without formal, in-depth assessments from qualified environmental professionals including coastal geomorphologists, who can provide expert guidance tailored at local scales.
To calculate reporting metrics utilized within both the Spotlight Community pages (i.e. Campbell River, Colwood, Comox Valley, Cordova Bay, Nanaimo, Port McNeill, North Saanich and Downtown Victoria and Esquimalt), Feature Manipulation Engine (FME) software was employed. Numerous FME workflows were developed. It should be noted that none of these workflows provide a level of precision that should be used for activities requiring real world alignment, such as engineering.
Additional Quality Assurance/Quality Control (QA/QC) was performed on the Resilient Coasts for Salmon data layers (i.e. coastal modification features, log accumulation and overwater structures) in QGIS to ensure accuracy of results. The QA/QC consisted of using QGIS vector geometry and vector analysis tools to summarize the Resilient Coasts data layers within community polygons.
This section highlights factors to keep in mind when interpreting the results produced by the Resilient Coasts for Salmon project.
General
- The length of a line feature, for shoreline modifications, does not correspond to the level of impact it may have on natural coastal processes.
- It is likely that a greater number of coastal modifications exist than what was digitized due to several reasons including:
- many elements in the landscape can obscure views, including dense vegetation;
- aerial imagery was less clear in some regions – digitization in some regions relied heavily on aerial imagery as its source;
- many features were observed that will imminently interact with natural coastal processes as sea levels rise but are not included in the dataset as they do not currently interact with coastal processes;
- the imagery sources used to digitize features vary, including the dates they were captured (dates are included for each feature within each dataset).
- The exact measurement and location of features that were digitized reflect the best of the recorders visual estimations and are not precise due to the complexity of using imagery to visualize real-world positions- the accuracy may vary by up to 3 metres for all data.
- All wall structures, whether built as shore protection or to delineate property lines or deter trespassers, are included as shoreline modifications when they meet the protocol criteria (i.e., if they could interact with natural coastal processes). All walls are classified under the attribute “seawalls/bulkheads,” although the intention behind building them may differ.
Data Gaps
- Gaps exist in all three datasets where boat-based or aerial imagery was not available, image quality was poor, the area was excluded for privacy reasons, or for other reasons.
- For this project, recorders made notes in the ‘comments’ section of the data when they were aware of restored segments of shoreline. However, this was not always apparent to the recorders, making it difficult to differentiate, for example, when riprap was used as part of a hybrid design or not.
- Imagery was not collected between the north edge of Campbell River and Port McNeill due to ocean conditions.
Estuary Protocols
- Most of the large estuaries were omitted from the quantitative analyses, as some estuaries required a distinct protocol that produced qualitative data. This is noted in the community reports when this occurred, and details can be found in the Mapping Coastal Modifications Digitization Protocol.
Shoreline Length Values
To report on the level of modified shoreline in a specific region, the Freshwater Atlas Coastlines (FAC) line was used as a proxy for total shoreline length. While the FAC provides a line from which analyses can be run, it is imperfect, and often resulted in overestimations of total shoreline length, producing discrepancies toward more conservative estimates. Some ways this occurs include:
- The polygons around each community analysed were created intentionally so that major nearby islets and islands not connected to Vancouver Island by road or bridge were excluded from the total shoreline length (FAC) to increase accuracy of analyses.
- The FAC line diverges from the locations of digitized features, which skews some results, often producing a higher total length of shoreline (Figure 1).
- Shorelines on First Nation reserve lands were not digitized out of respect for privacy, so those shorelines were excluded from the analyses. In some cases, the Federal Government reserve land boundaries were slightly waterward of the FAC (Figure 2).


Conservative Values due to Timing of Mapping
Because the imagery was captured during the summer months when storms are less frequent, there is a high likelihood that the log accumulation data layer represents a lower threshold of accumulation than what a specific area may hold during winter months.
Limited Shoreline Type Options
There are segments of shoreline that have been modified by restoration using a “hybrid” approach (i.e., using both “hard” and “soft” elements in their design). However, these features are not separated from “hard” shoreline protection in this protocol. Recorders made notes in the Comments section when they were aware of such projects; however not all are known, nor would all hybrid restoration projects be visibly obvious. For example, riprap can be a part of a hybrid approach to shoreline protection but is considered a coastal modification feature in this protocol.
Additional Imagery Capture
For estuaries and certain bays where access was difficult by a larger vessel, shoreline imagery was collected by alternative means. This includes imagery capture my tender (small vessel), drone, or on foot. In most cases for estuaries, shoreline imagery capture was not possible, so digitization was completed through available aerial imagery.
Accessing the Data
The raw Resilient Coasts for Salmon data (i.e. coastal modification features, overwater structures and log accumulation) are available for download for this community, and others, as well as the entire east coast of Vancouver island. Visit the Resilient Coasts for Salmon page within the Marine Data Portal.
How to Cite the Data
Pacific Salmon Foundation. (2026). Resilient Coasts for Salmon (Data set). Marine Science Program, Pacific Salmon Foundation. Retrieved [INSERT DATE], from https://doi.org/10.48689/4612bfa4-c7e4-4a3f-b2e6-f54420291092.
Tell Us!
Our intentions in making these data publicly available is that they are used at the community level to inform decision making. Please reach out to let us know how you have used the data. Get in touch at , or fill out our feedback form for the interactive map.
The Resilient Coasts for Salmon team strongly recommends that any future data collection/digitization begin with formal processes for securing permission from each First Nation on whose territory you hope to work in, as noted in their specific engagement protocols.
We did not digitize shoreline modification features within reserve lands out of respect for privacy. We recognize that reserve lands are a product of colonialism and do not accurately reflect First Nations’ traditional territories. The territories of First Nations encompass lands, waters, and everything in between, that extend beyond colonially set boundaries. In our efforts to honour First Nations’ data sovereignty, we made concerted efforts to avoid digitizing imagery that could consist of any culturally sensitive and significant features. However, we acknowledge our very limited understanding of the full extent of these considerations. Further, we recognize the sensitivity of publicly available data and imagery and have reached out to First Nations within the project scope to identify areas to exclude from both imagery and digitized data. Please contact to have data and imagery removed from public access at any time going forward. If capacity is limited, please let us know so we can provide support.
We strongly advise that all initiatives stemming from the results presented be guided and prioritized by local Indigenous governments and Nation members from inception, with financial compensation for their time as noted in each Nation’s protocols for engagement.
Additional Maps
Use the sliders below to explore the additional static maps that we created for the CVRD, and click the thumbnails to open the maps in full page. These include maps of our three Resilient Coasts for Salmon data layers: coastal modifications, log accumulation and overwater structures, as well as maps which overlay our data with additional data of interest created by external groups and organizations. See the individual maps for information about the data used. Explore the interactive map on the Resilient Coasts for Salmon Atlas home page to view these datasets and others at various scales. You can also visit the Marine Data Portal catalogue to explore data like these and many others that are available to download.


References
Huard, J. R., Proudfoot, B., Rooper, C. R., Martin, T. G., and C. L. K. Robinson. 2022. Intertidal beach habitat suitability model for Pacific sand lance (Ammodytes personatus) in the Salish Sea, Canada. Canadian Journal of Fisheries and Aquatic Sciences. 79, 10. doi: https://doi.org/10.1139/cjfas-2021-0335
K’ómoks First Nation Home. 2021. K’ómoks First Nation. [accessed 2025 Aug 29]. https://komoks.ca.