Hydrography in the Strait
Hydrography is the description of physical features of the ocean and is the starting point for any analysis of water circulation and the understanding of life within the ocean.
Standard hydrographic properties in the ocean include water temperature, salinity, the dissolved oxygen content, total chlorophyll (as a proxy for the total amount of phytoplankton at depths where light can penetrate), and water clarity, which affects the depth to which light penetrates.
The largest changes in the Strait of Georgia are seasonal, but over longer periods, there are noticeable changes from year to year as well in response to larger climatic variations such as El Niño cycles. The seasonal cycle will provide some background for the changes from year to year, and so sometimes we want to consider the anomalies relative to this mean seasonal cycle.
Dissolved oxygen in the water is crucial for fish. While extreme low levels (around 2 parts per million) can be fatal (which is rare in the Strait of Georgia), fish can still struggle to grow well even at higher levels. To protect all stages of aquatic life, guidelines suggest that oxygen levels should be at least 5 parts per million instantly and no less than 8 parts per million on average over 30 days. In our graphs, we use a 6 parts per million line for the short-term safety limit and an 8 parts per million line for the long-term limit. Staying in waters above these limits often means fish are restricted to quite shallow waters, especially in the late summer.


Our Methods
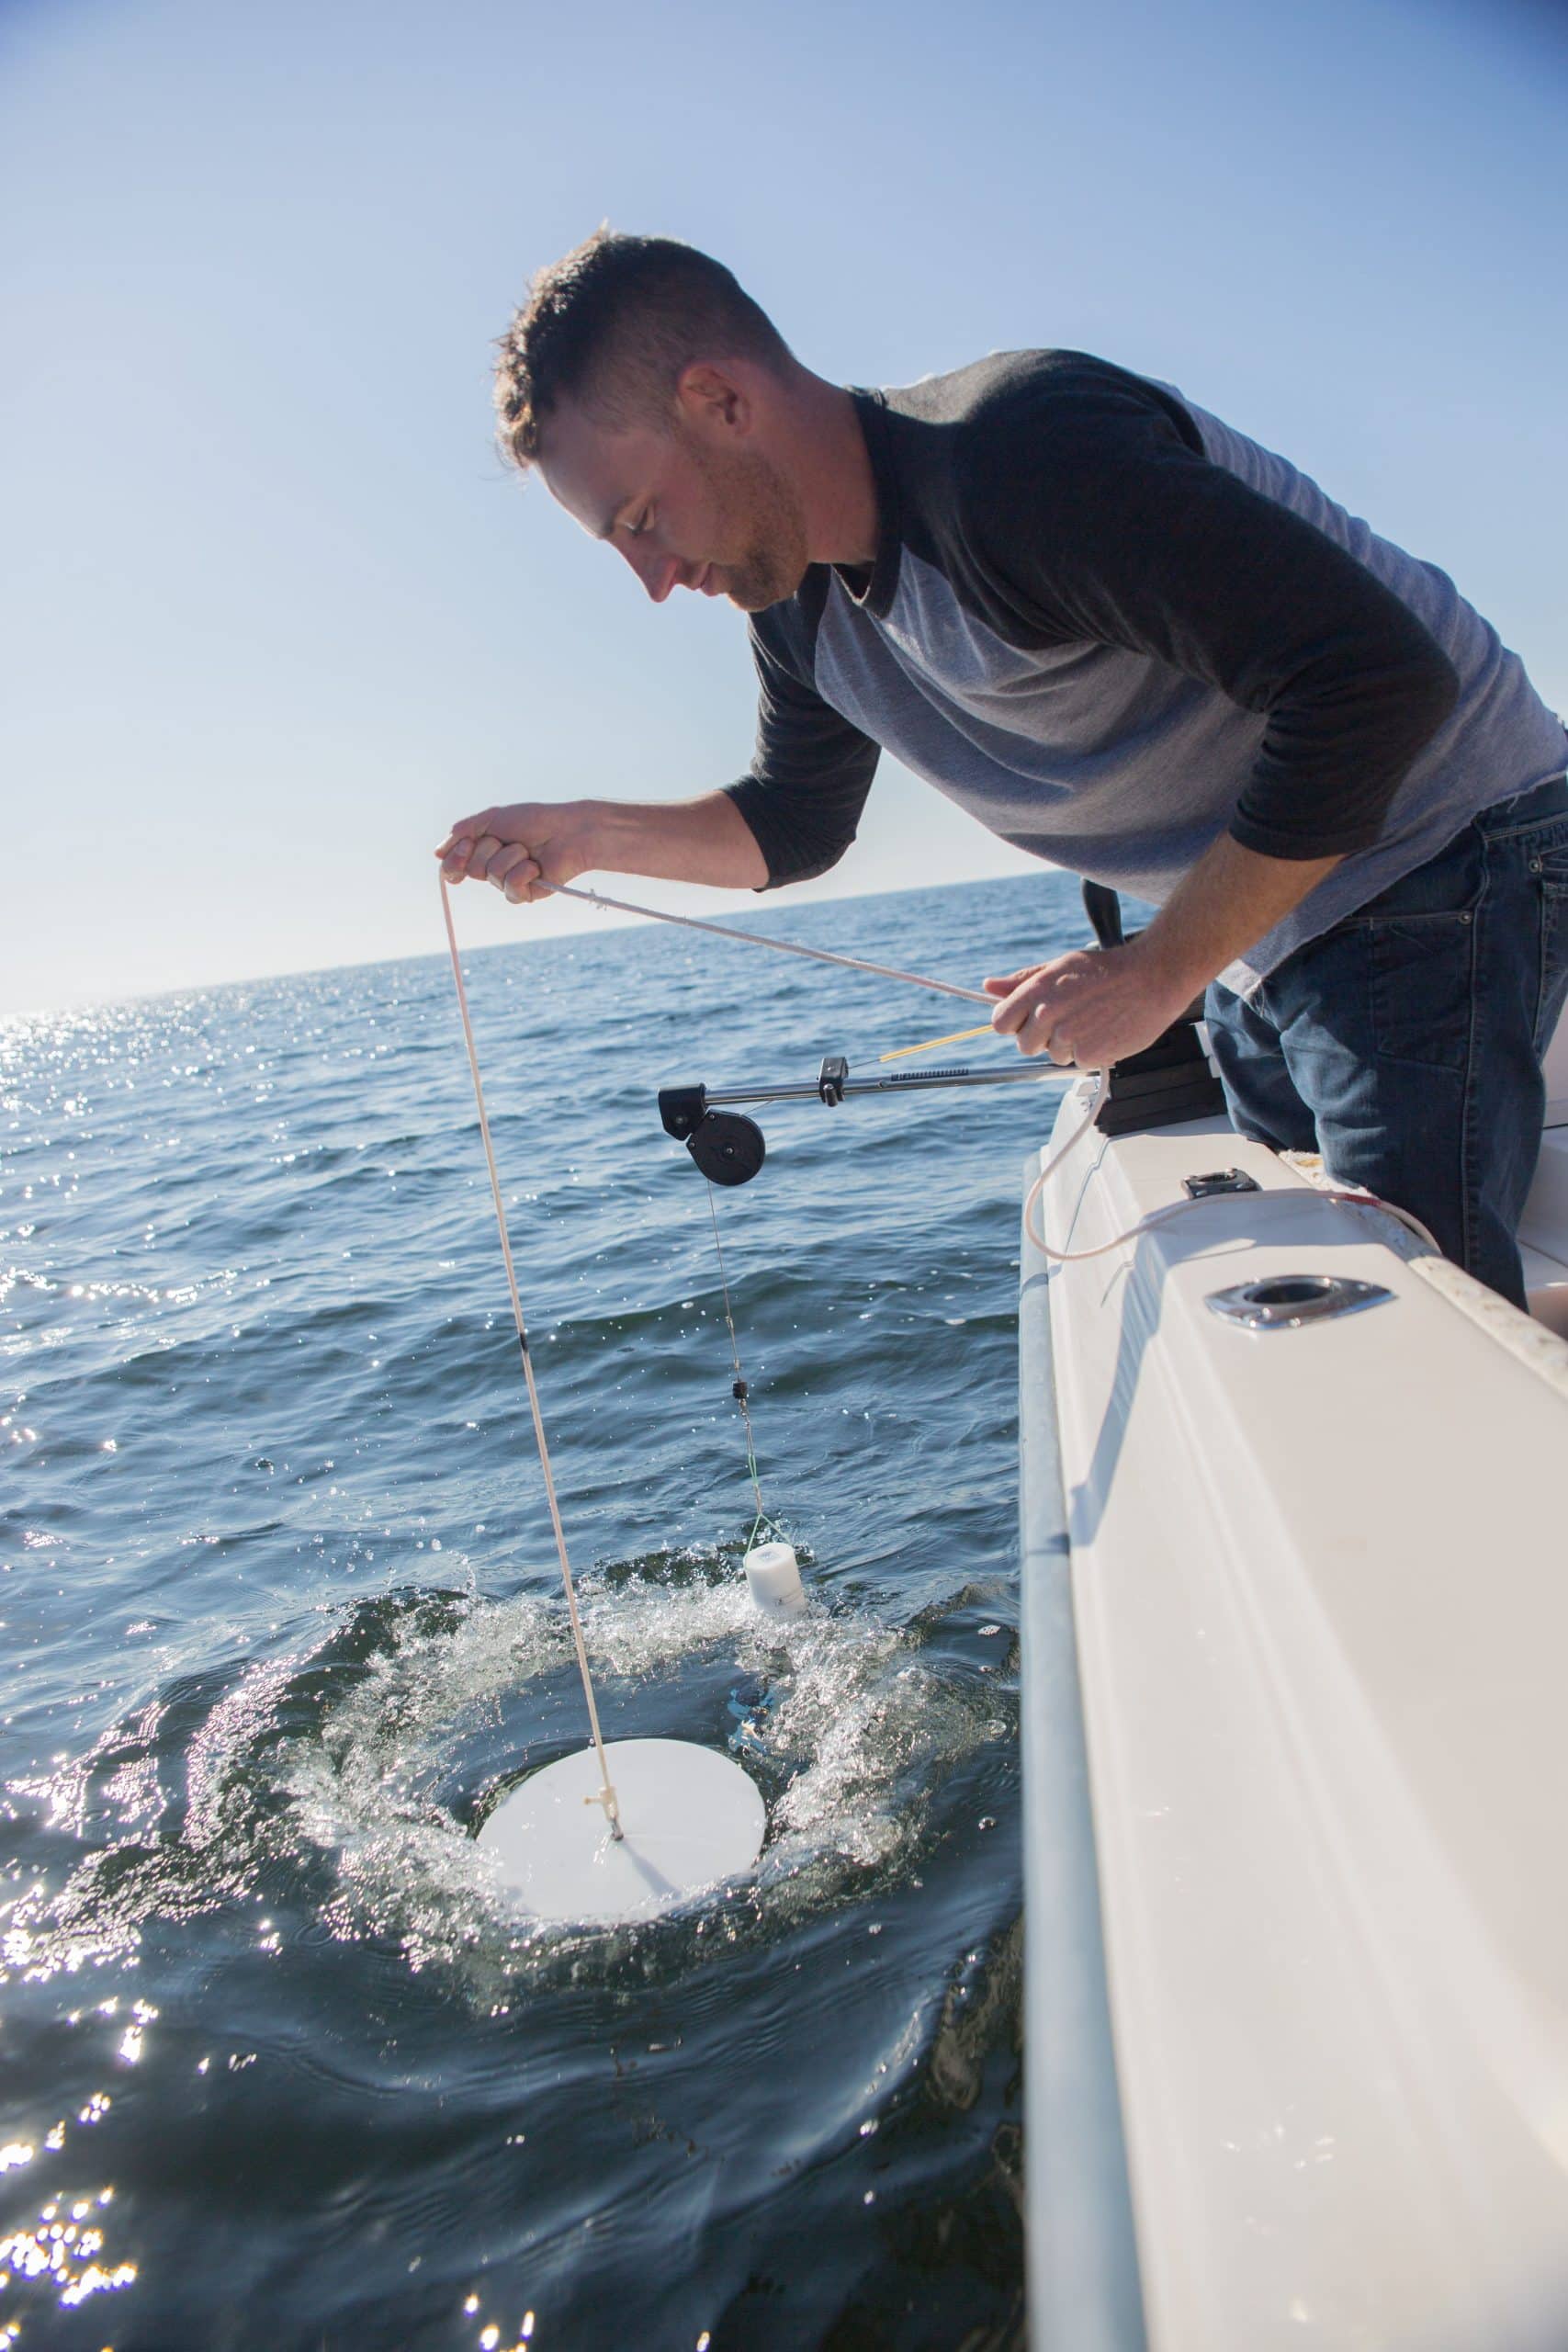
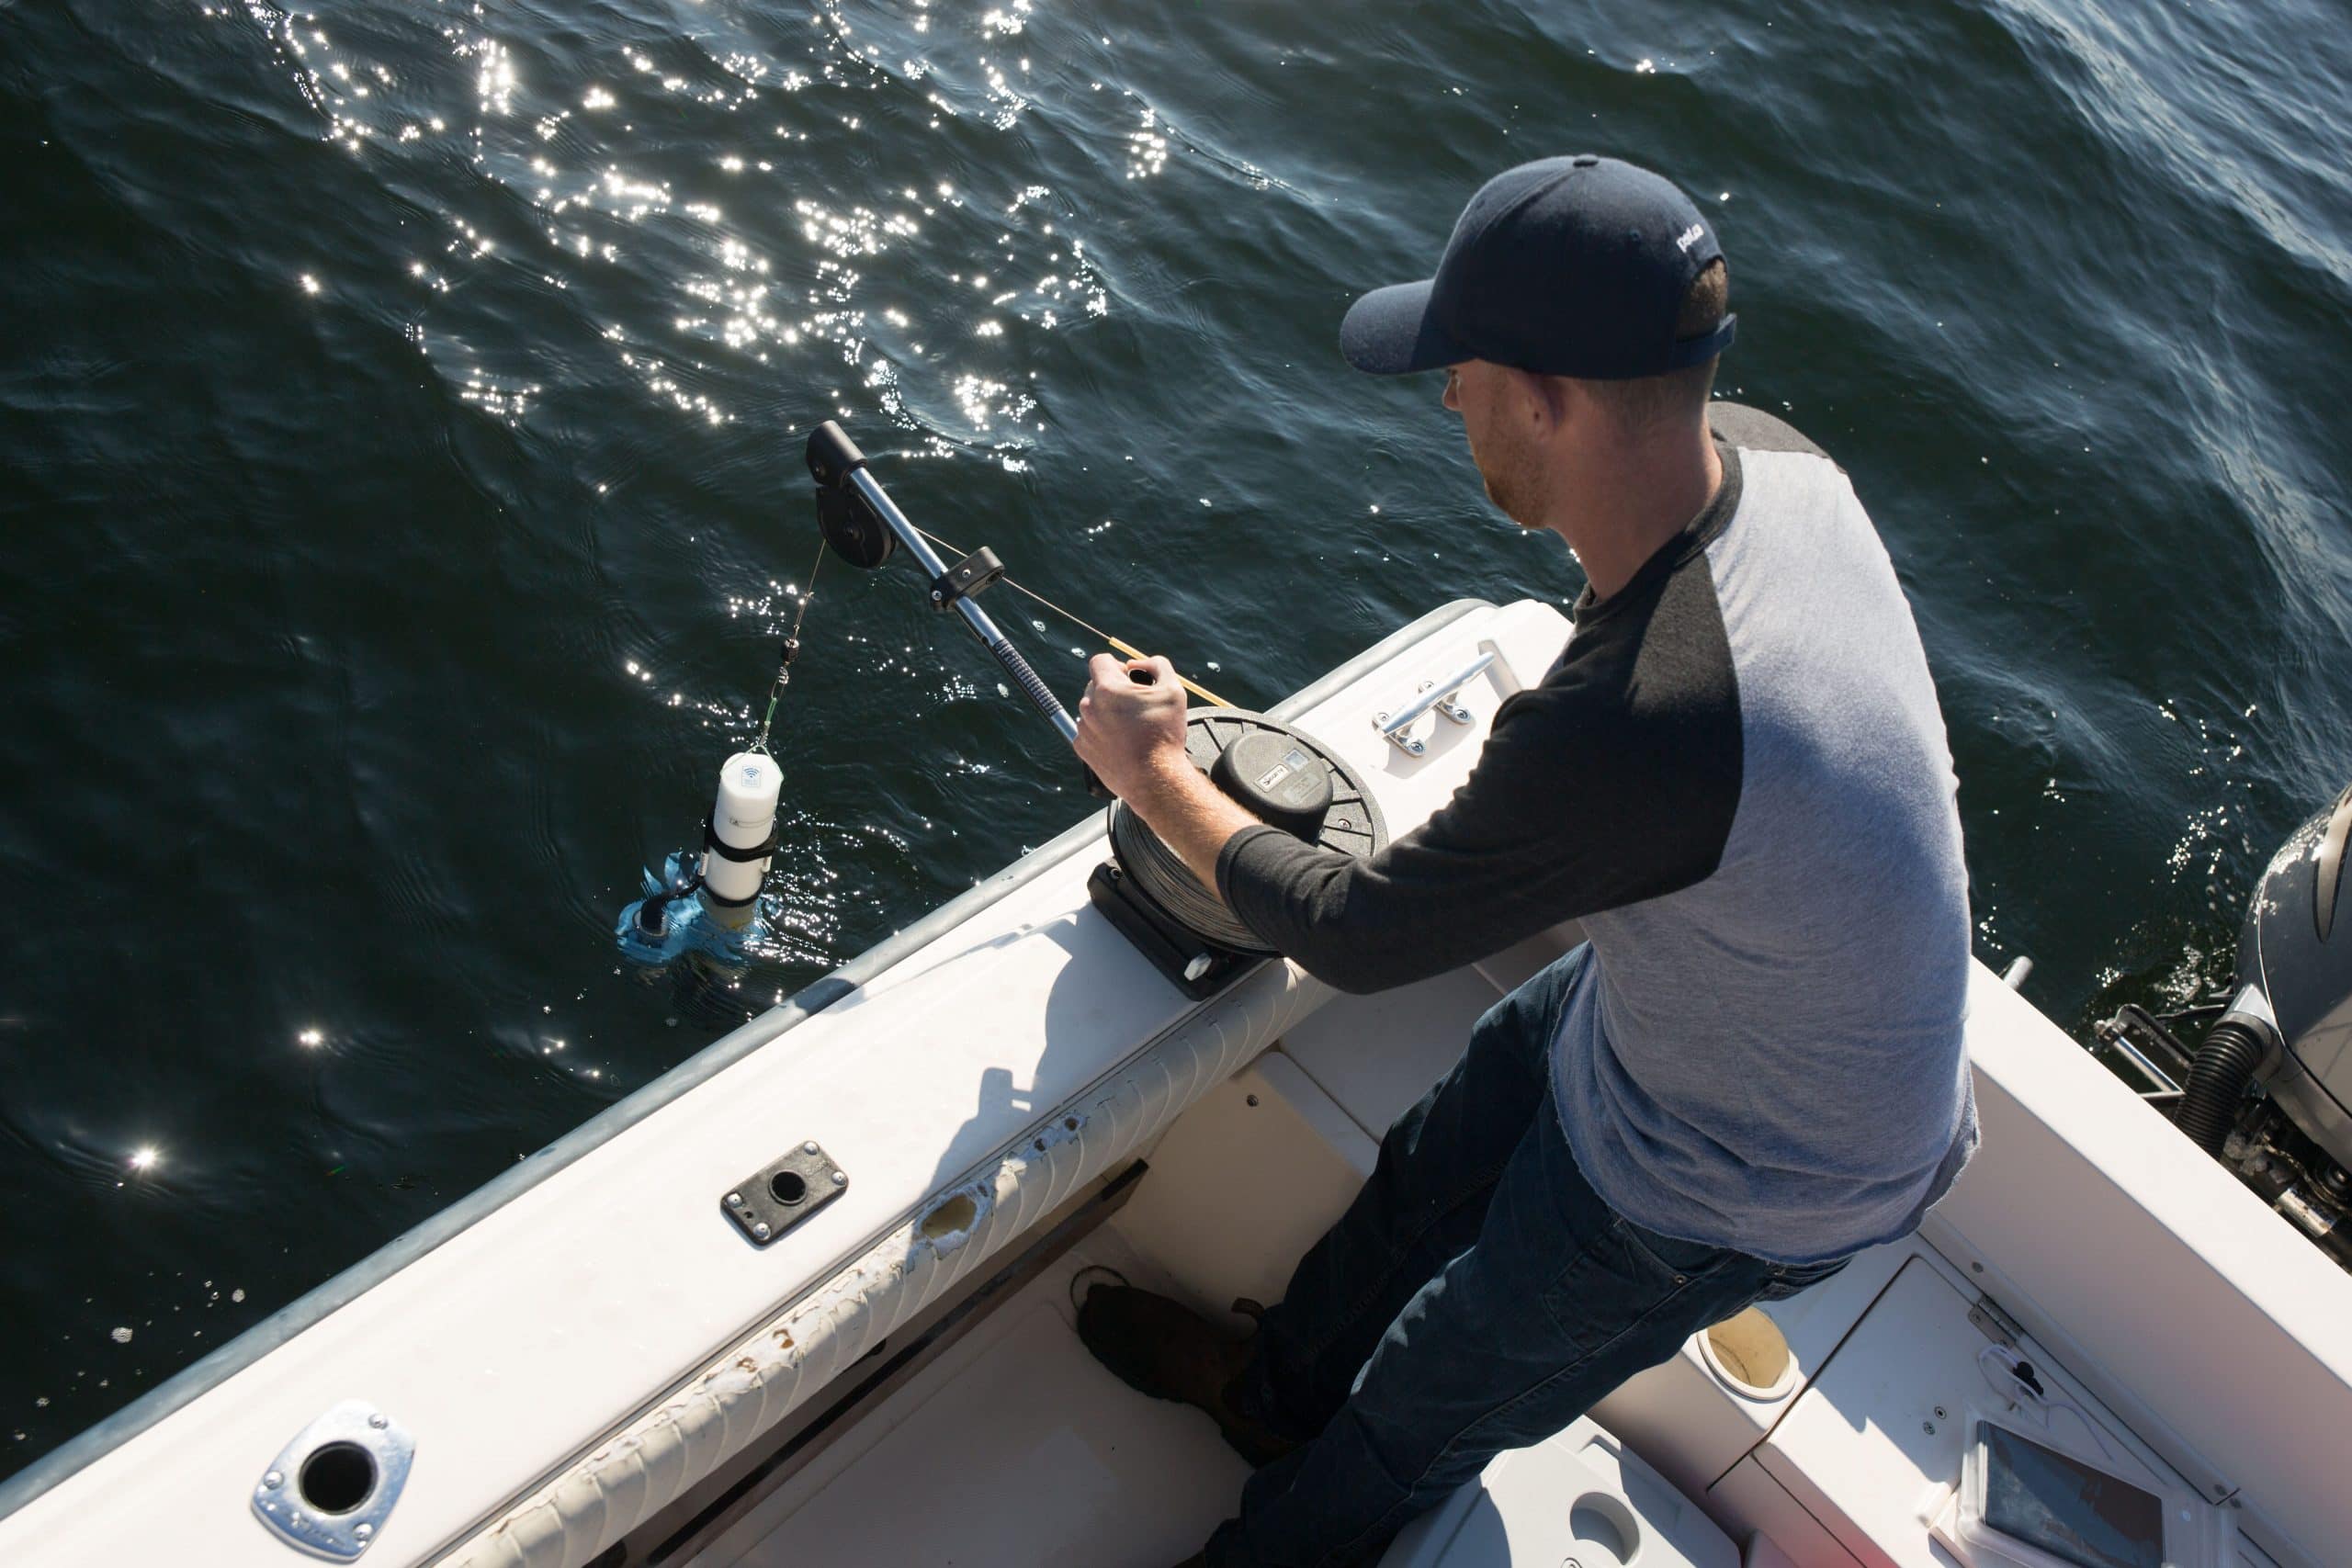
At each station, an electronic CTD (for conductivity – temperature – depth) probe is lowered to the bottom or a depth of 150 m, whichever is less, using a hand-cranked reel. These probes measure water temperature, water salinity (using the electrical conductivity of the water which arises from the presence of dissolved sea salt), and pressure, from which depth can be determined, continuously through the whole vertical profile. RBR-Concerto CTD probes were used from 2015-2020. In 2021 these were replaced with AML-6 CTD probes.
CTD data are transferred through a wifi link to a tablet equipped with a purpose-written software app, at which point meta-data (e.g. station names and locations) is added. These data are then transmitted for archiving at Ocean Networks Canada.
Data are sent electronically to the Ocean Networks Canada archive. The ONC staff address errors such as missing positions, faulty readings due to sensor issues, or equipment not being properly prepared. Then, they create “profiles” at standard depths.
Our Data
The Citizen Science Oceanography Program team has worked on processing their data to answer a number of research questions. They have produced figures displaying mean near-surface conditions for the Strait of Georgia since 2015, as well as special figures showing anomalies around the seasonal mean for different variables. They have produced contour plots and hydrographic profiles of temperature, salinity, chlorophyll, and dissolved oxygen to illustrate seasonal and spatial variations within the Strait. These hydrographic profiles highlight key environmental changes throughout the year.
The Strait of Georgia’s water properties exhibit significant variability influenced by larger Pacific climate patterns such as El Niño/Southern Oscillation (ENSO), Pacific Decadal Oscillation (PDO), and North Pacific Gyre Oscillation (NPGO). ENSO affects global climate, impacting temperatures and precipitation, while PDO drives multi-decadal temperature cycles across the North Pacific. NPGO influences sea-surface height and nutrient levels, affecting marine ecosystems. The team has produced a series of figures that will help visualize how the Strait of Georgia conditions are linked to different climate indicators.
In Cowichan Bay, a key research site, water properties such as temperature, salinity, oxygen, and chlorophyll are monitored with minimal spatial variation. Data collected is compared with the flow of the Cowichan River, providing insight into regional water conditions. Regional variations in phytoplankton concentrations, Secchi depths, surface temperature, and salinity are analyzed through seasonal intervals, reflecting broader environmental trends. They also provide with a series of graphs showing the regional average temperature, salinity, oxygen and chlorophyll compared to the flow of the Cowichan river.
A preliminary examination of water properties in Puget Sound and surrounding areas, using data from the Washington State Department of Ecology, has been conducted to understand regional conditions in the southern Gulf Islands, eastern Juan de Fuca Strait, and Puget Sound Main Basin. The team created a series of graphs displaying mean conditions in Puget Sound for temperature, salinity, dissolved oxyygen, and chlorophyll through time.
Click here to learn more about hydrography, their methodology, and to acces the figures. Click here to access the data.
References
- Raw and processed CSOP, Tsleil-Waututh, and Snuneymuxw hydrographic profiles are archived at Ocean Networks Canada, and are available through their Ocean 2.0 Data Search interface.
- New in 2021, profile data from all of ONC’s “Community Fishers” programs are available relatively quickly in a geospatial map application at data.oceannetworks.ca/GeospatialMap.
- Quality-controlled CitSci profiles used in these figures are available in a single spreadsheet for each year here at our data portal.
- Fisheries and Oceans data are available through their archive at waterproperties.ca; some data are also available at the Canadian Integrated Ocean Observing System’s Pacific node at cioospacific.ca.
- Hakai Institute data are available at at data.hakai.org or cioospacific.ca.
- Profiles from US waters come from two sources:
- For 1999-2017: Washington State Department of Ecology. 2024. Long-Term Marine Waters Monitoring, Water Column Program [data set]. Olympia, WA. Retrieved from Washington State Department of Ecology Environmental Information Management System web site Study ID “MarineWater” and Monitoring Program ID “MarineAmbient”. https://apps.ecology.wa.gov/eim/search/SMP/MarineAmbientSearch.aspx?StudyMonitoringProgramUserId=MarineAmbient&StudyMonitoringProgramUserIdSearchType=Equals
- For 2018-2024: Washington State Department of Ecology. 2024. Long-Term Marine Waters Monitoring, Water Column Program [data set]. Olympia, WA. Data retrieved from public data request [February 2024]. https://ecologywa.govqa.us/WEBAPP/_rs/(S(poxpsv5ptjh2ykdozo5fcig3))/supporthome.aspx
